
2H 2026 Basic Service Rates rise 14% from year-ago levels; 1H 2027 rates expected to increase another 12% year over year

Basic Service Rates for four New England states have increased, or are set to increase, in the second half of 2026 following recent utility procurements. Across six utilities in the four states, rates will increase by an average of 14% from year-ago levels (Figure 1). On a load-weighted basis, rates will increase by 14% in Massachusetts, 15% in Rhode Island, 25% in New Hampshire, and 3% in Connecticut.
Figure 1. Year-Over-Year Basic Service Rate Changes, 2H 2026 ($/kWh)
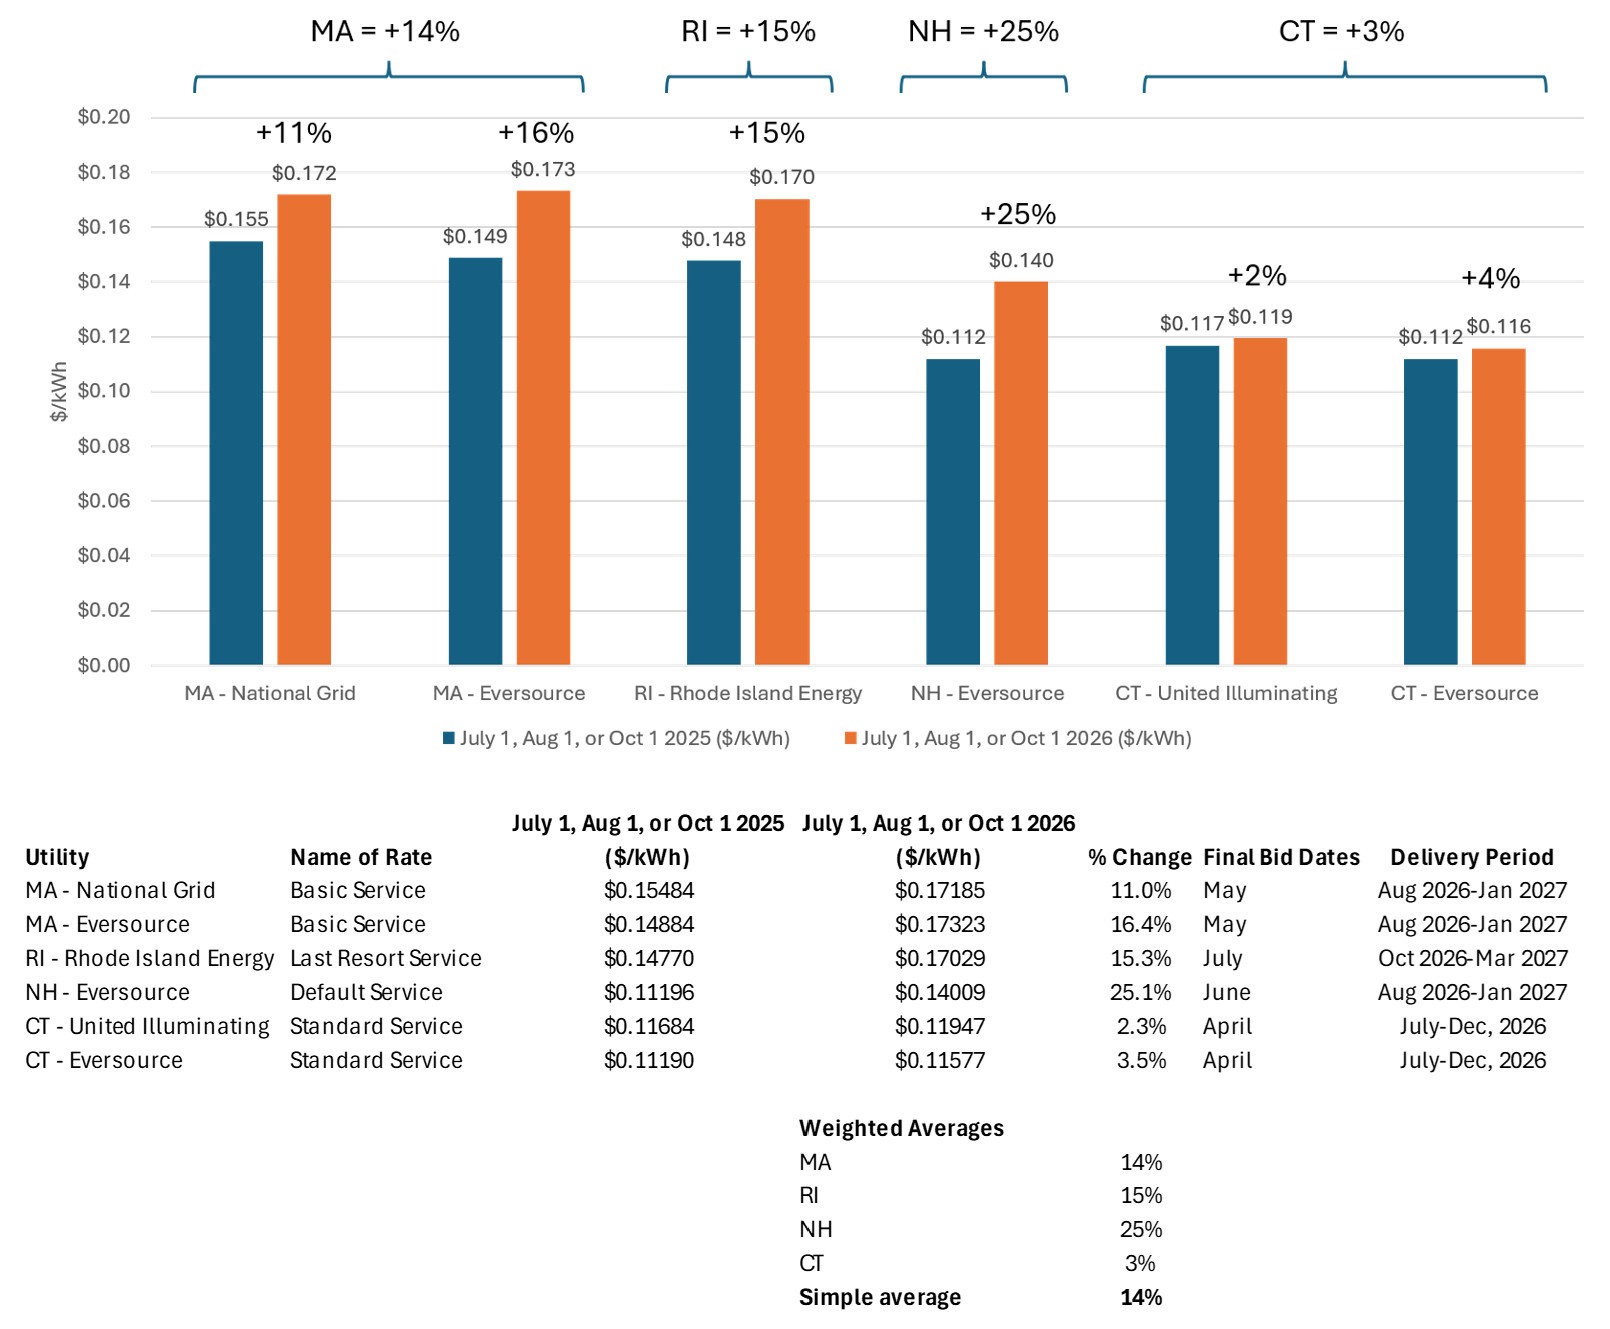
This follows a similar increase in the first half of 2026, when Basic Service Rates rose by approximately 15%. This means net metering and community solar project owners will receive higher payouts. Some of the reasons for these higher prices are described below.
Higher Natural Gas Prices Drive Higher Power Prices
The increase in Basic Service Rates primarily reflects higher wholesale electricity prices, which in New England remain closely tied to natural gas prices. Natural gas forward prices were elevated and unusually volatile during the periods when utilities procured supply for the second half of 2026, largely as a result of the Iran conflict and associated disruptions in the Strait of Hormuz.
More broadly, New England natural gas and power prices continue to be shaped by three factors: global LNG demand, geopolitical risk, and the region's constrained natural gas infrastructure.
A Cold Winter Added Further Pressure
Last winter was the coldest in approximately 20 years, according to ISO New England, contributing to periods of very high wholesale electricity prices. For some utilities, costs incurred during those periods are now being recovered through 2H 2026 generation charges.
NECEC Began Commercial Operation but Is Not Yet at Full Capacity
NECEC, the 1,200 MW transmission line delivering power from Quebec into Massachusetts, has been operating since January 16, 2026, but its first eight months have been marked by significant instability rather than steady, reliable delivery (see daily average flows in Figure 2). When running, the line carries close to its full rated capacity of 1,200 MW (typically 1,090-1,150 MW), but it has been knocked offline or curtailed repeatedly: a rocky first two weeks of curtailment in late January, a planned maintenance outage in early-to-mid April, a brief dip April 28, then a rougher stretch in May with an emergency outage May 19-22 followed almost immediately by a two-week shutdown from late May into early June attributed to "technical difficulties." A further anomaly appeared in late August, with flows dropping to near zero and briefly going slightly negative for about a week. Volume-wise, the line has delivered well below its contracted obligation – roughly 40% of Massachusetts's 9.55 TWh annual target through mid-2026 — with the shortfall driven mainly by drought-constrained hydro supply in Quebec rather than by the outages themselves.
Figure 2. Daily Average Hydro-Québec (HQ)Imports over NECEC into the Lewiston, Maine interface, MW
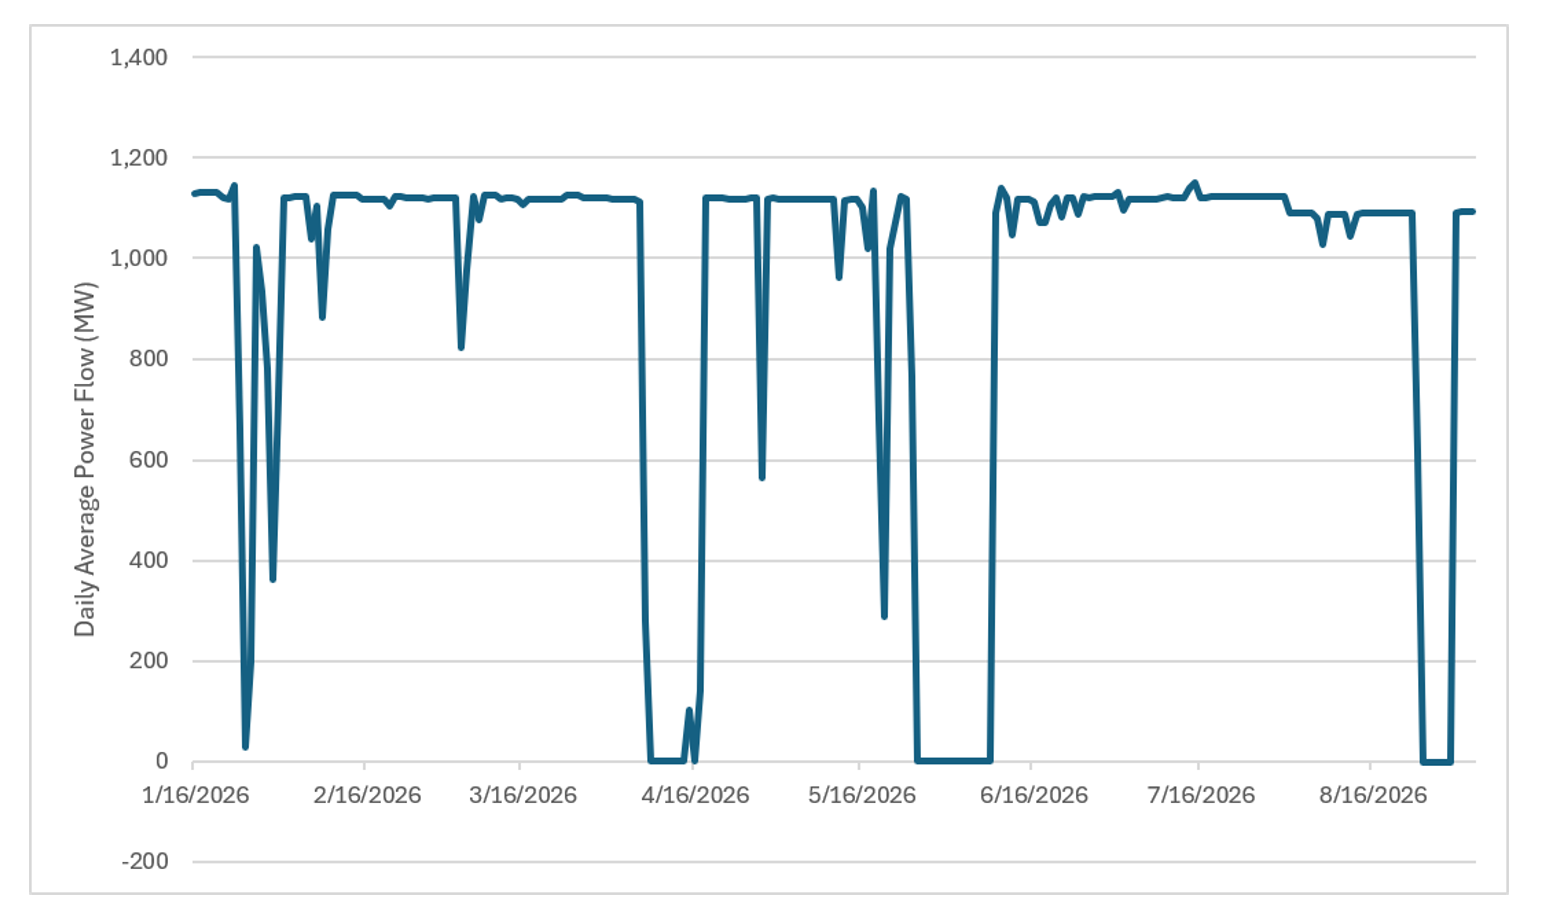
So NECEC is not yet operating reliably at full capacity, though it isn't for lack of transmission capability: when the line is up, it runs near its rating. The bigger story analysts are pointing to is that the line hasn't actually increased New England's net hydropower imports from Quebec, since Hydro-Québec has simultaneously scaled back exports on the older Phase 2 line and even reversed flow on it at times – meaning NECEC has mostly rerouted existing supply rather than adding new clean energy to the region, at real cost and with a rough first year of outages along the way.
As a result, whatever downward pressure NECEC may ultimately exert on regional power prices has not been evident in this round of Basic Service pricing.
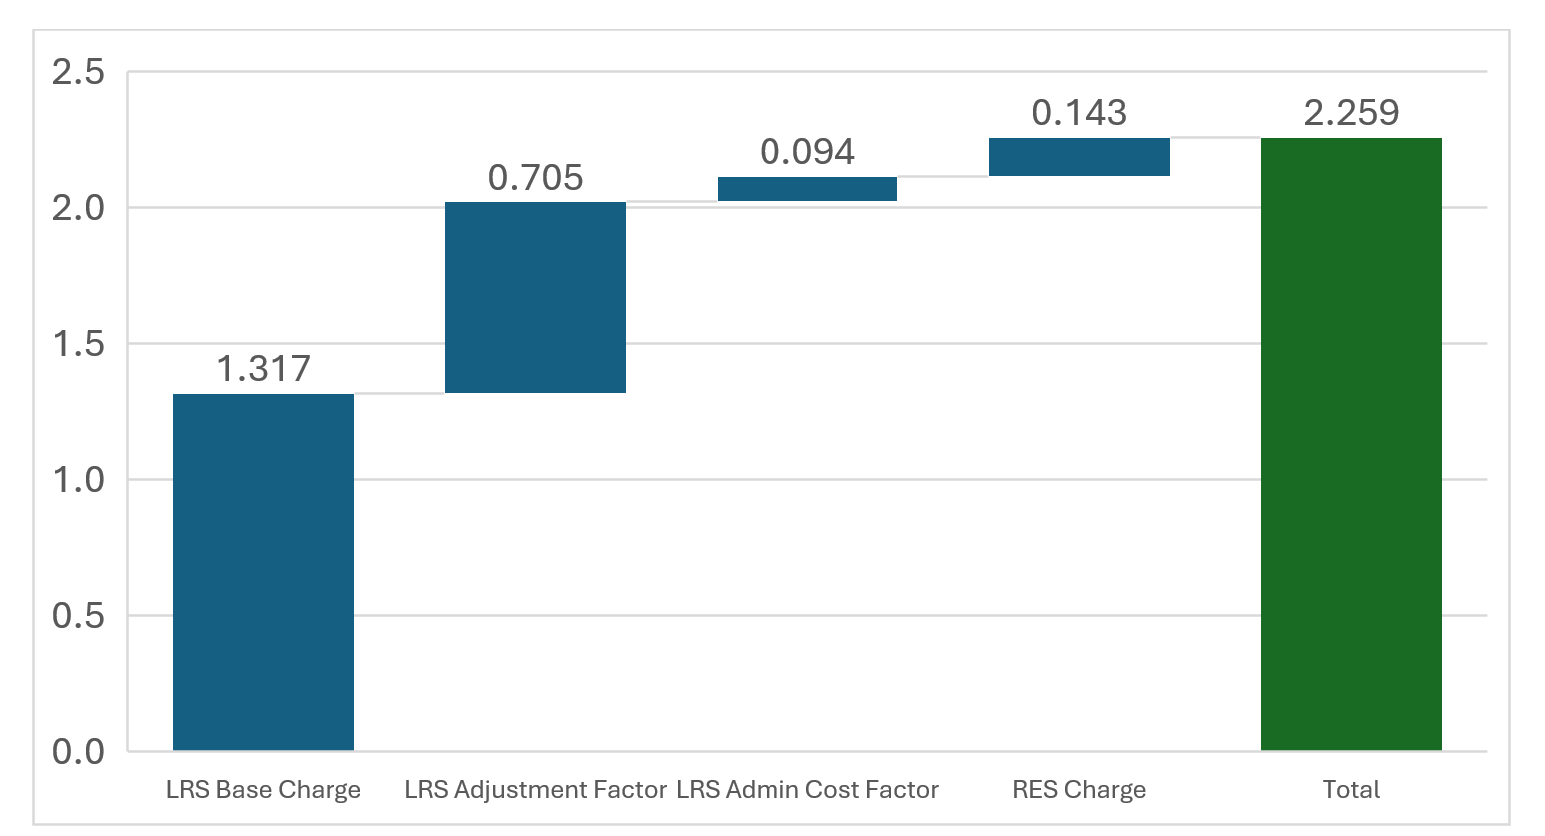
Some state specific drivers include the following:
Figure 3. Rhode Island Energy Year-Over Year Changes by Cost Component, Cents/kWh
Higher Rates Are Likely to Continue Into 2027The same factors driving higher 2H 2026 generation charges are expected to carry forward into 2027. Based on current forward prices and completed procurements, Basic Service Rates for the first half of 2027 are forecast to increase by an average of approximately 12% from year-ago levels (Figure 4).
Figure 4. Year-Over-Year Basic Service Rate Changes, 1H 2027 ($/kWh)
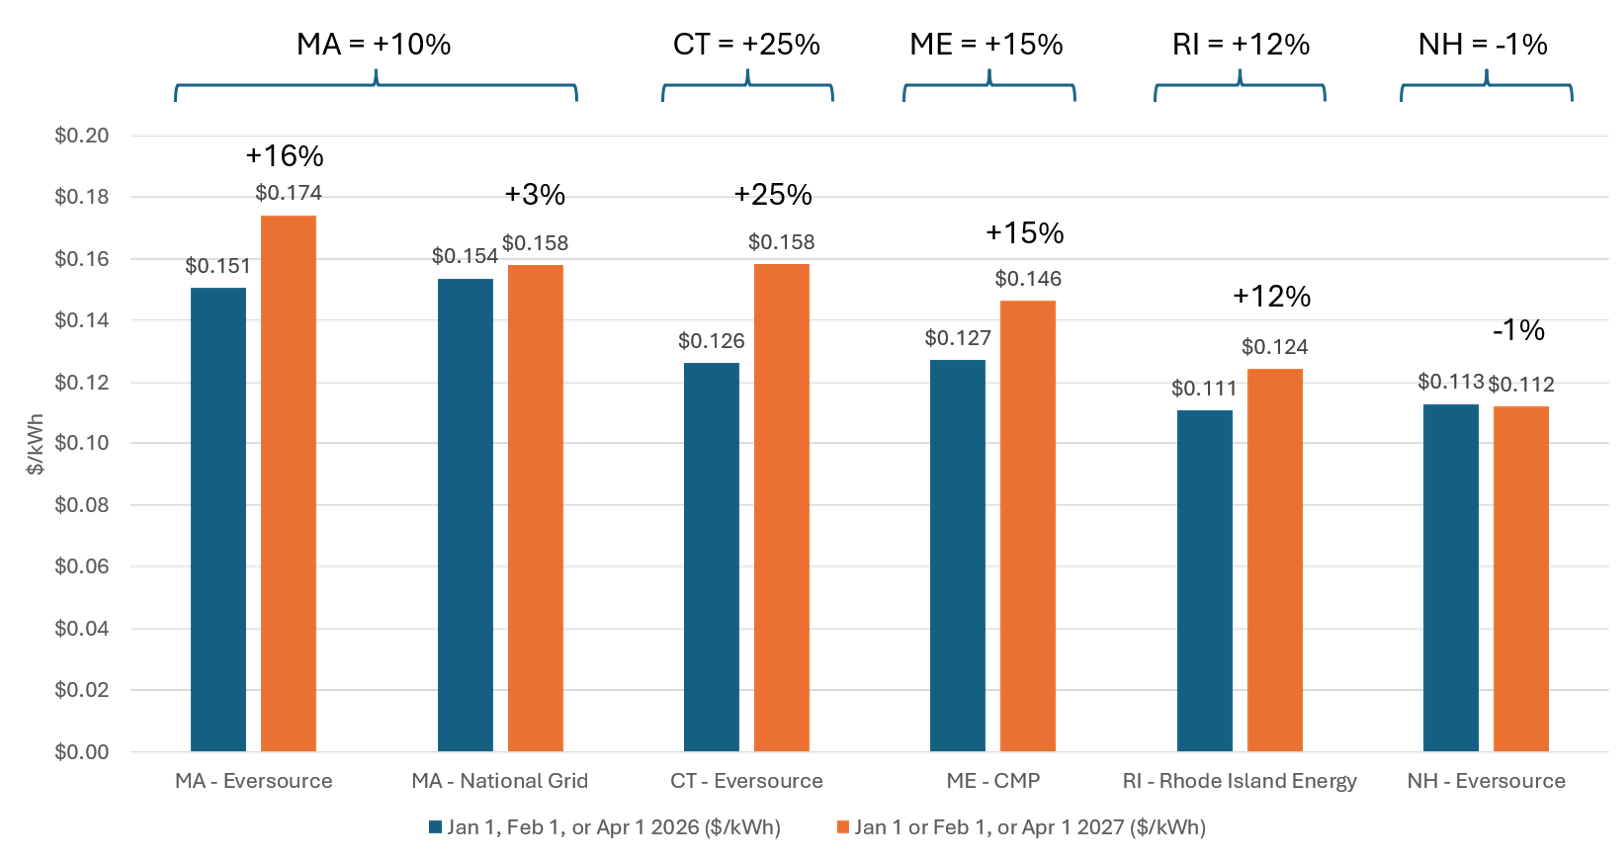
The largest projected increase is for Eversource in Connecticut, where the state's procurement process changed this year. Power requirements for 1H 2027 are being purchased from third party vendors in four tranches rather than at a single point in time.
Eversource bought 10% of its 1H 2027 requirement on January 27, 30% on April 7, and 40% on July 14. The remaining 20% is scheduled to be purchased in October. Although Eversource disclosed the timing of these purchases in its compliance filings, the procurement prices remain confidential and will not be disclosed until 100% of the required supply has been purchased.
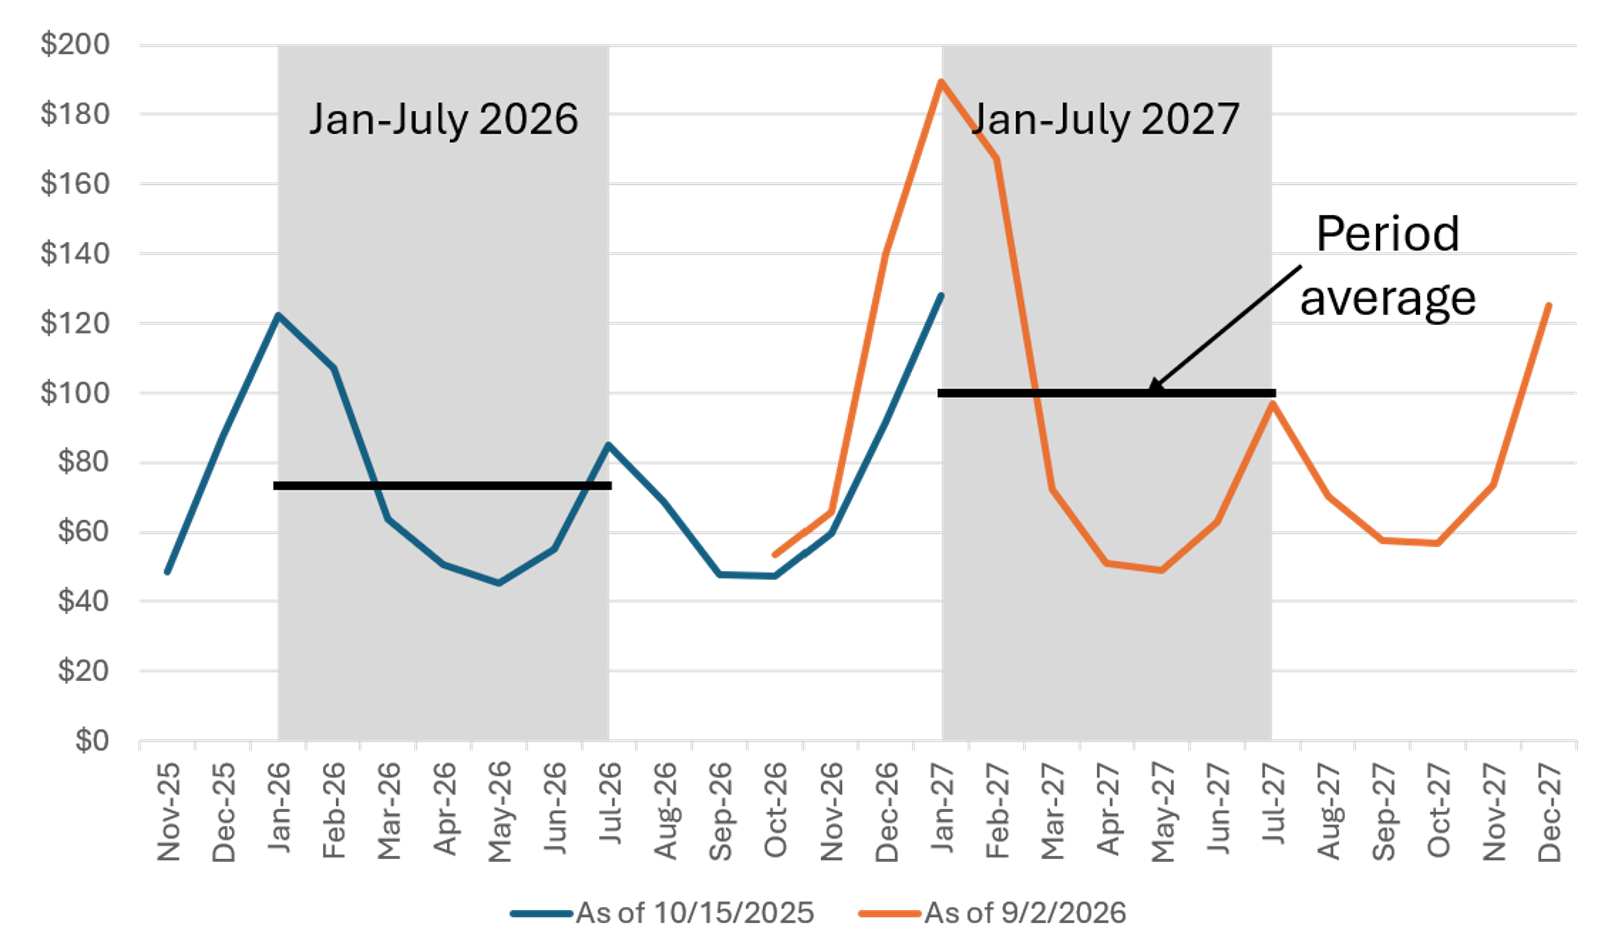
As of today, Eversource has therefore already locked in 80% of its 1H 2027 requirement. Comparing forward power prices on those procurement dates with the forward prices prevailing when supply was purchased for 1H 2026 suggests that Eversource's generation charge could increase by approximately 25% year over year.
Had 100% of the requirement instead been purchased at today's forward prices, the implied increase would have been approximately 33%. Staggering the procurement therefore appears to have provided customers with some protection from the more recent increase in forward prices.
The reason that Eversource is getting particularly hard hit in terms of year over year increase is two-fold: first, it is procuring for the January-June delivery period, a period that includes the two highest priced months of the year, January and February (Figure 5). Second, when power was procured for 1H of 2025, the Iran conflict had not yet begun and thus prices were much lower.
Figure 5. Forward Power Prices - New England Related to Connecticut Procurements ($/MWh)
For the other utilities, the projected percentage increases shown in Figure 4 were estimated by comparing current forward prices with the forward prices prevailing when supply for the corresponding period a year earlier was procured.
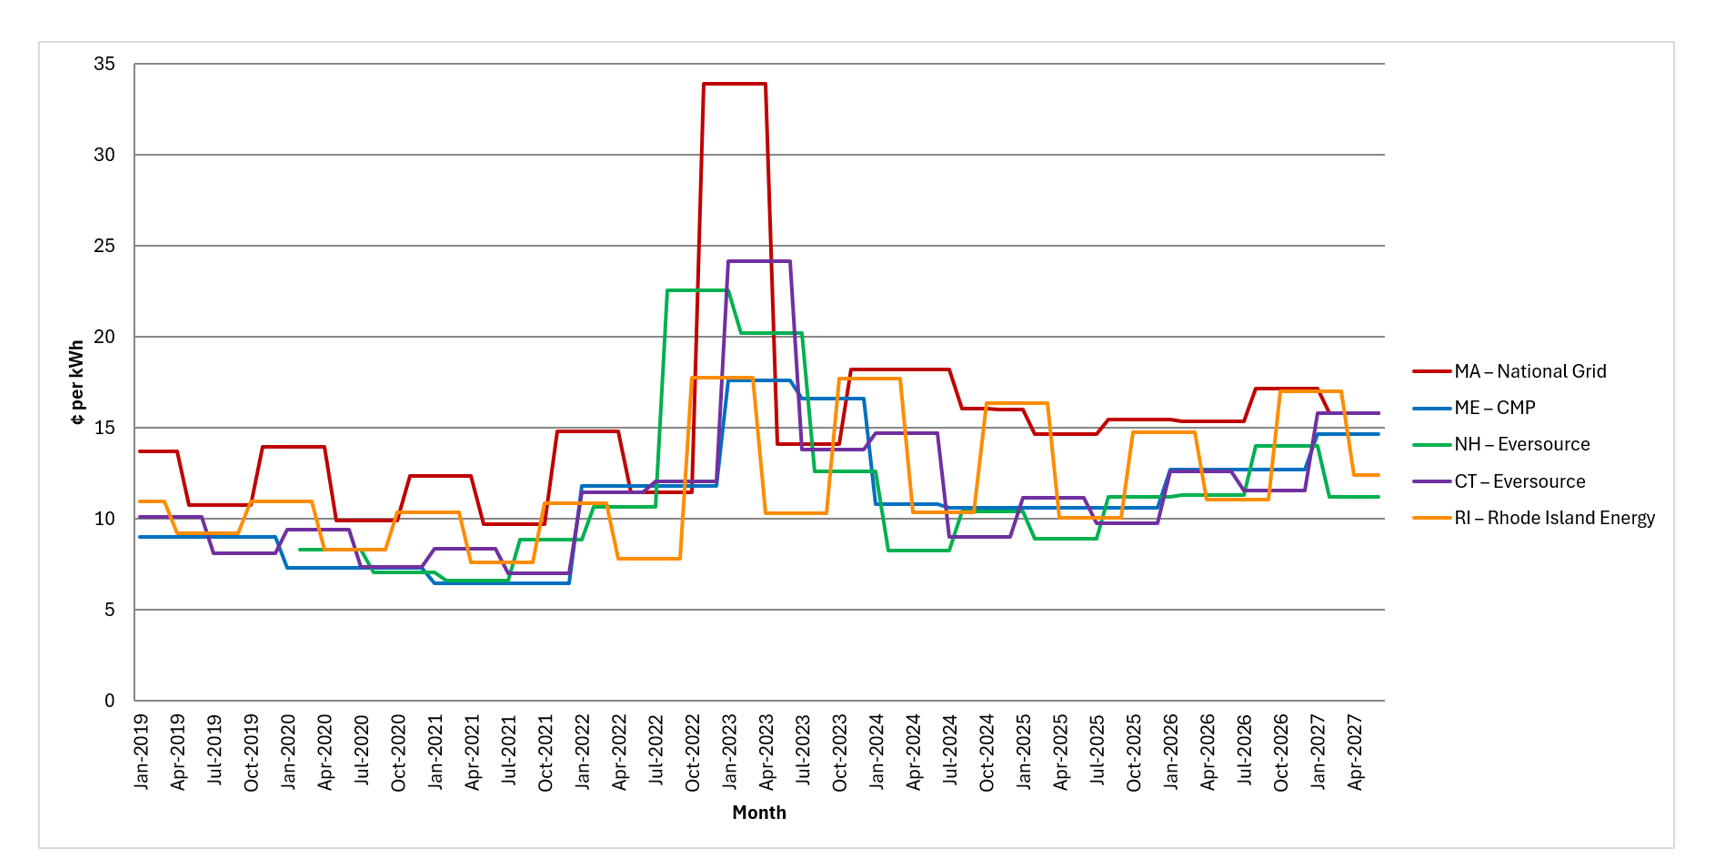
Figure 6 shows the monthly residential generation charges by utility dating back to 2019. Each state’s largest utility is shown. As described in this article, rates have been increasing for the past 12 months and are expected to move higher again in 2027. Earlier, rates spiked in late 2022 and early 2023, following the outset of the Russia/Ukraine war in February 2022, before settling back down.
Figure 6. Monthly Residential Generation Charge by Utility (2019 – H1 2027E) (Cents/kWh)
Taken together, the results point to continued upward pressure on New England Basic Service Rates into 2027. Elevated natural gas prices remain the principal driver, while geopolitical risk, limited gas infrastructure, weak Quebec imports, and the uneven initial contribution from NECEC have provided little offset. For community solar and net metering projects whose compensation is linked to Basic Service Rates, that environment should continue to support higher generation-related compensation into the first half of 2027.
Andrew Kinross can be reached at akinross@poweradvisoryllc.com.