On July 27, 2025, the IESO issued an “Energy Emergency Level 1” advisory notice. The notice stated that starting on July 28 at 12:00 EST to July 28 at 22:00 EST, “The IESO has declared an Energy Emergency Alert Level 1. There is the potential for declaration of an emergency operating state.” Similarly, on July 28, 2025 the IESO issued another energy emergency level 1 advisory notice starting on July 29 at 10:00 EST to July 29 at 22:00 EST.
Weekly Day-Ahead and Real-Time Price Trends by Components and by Zone
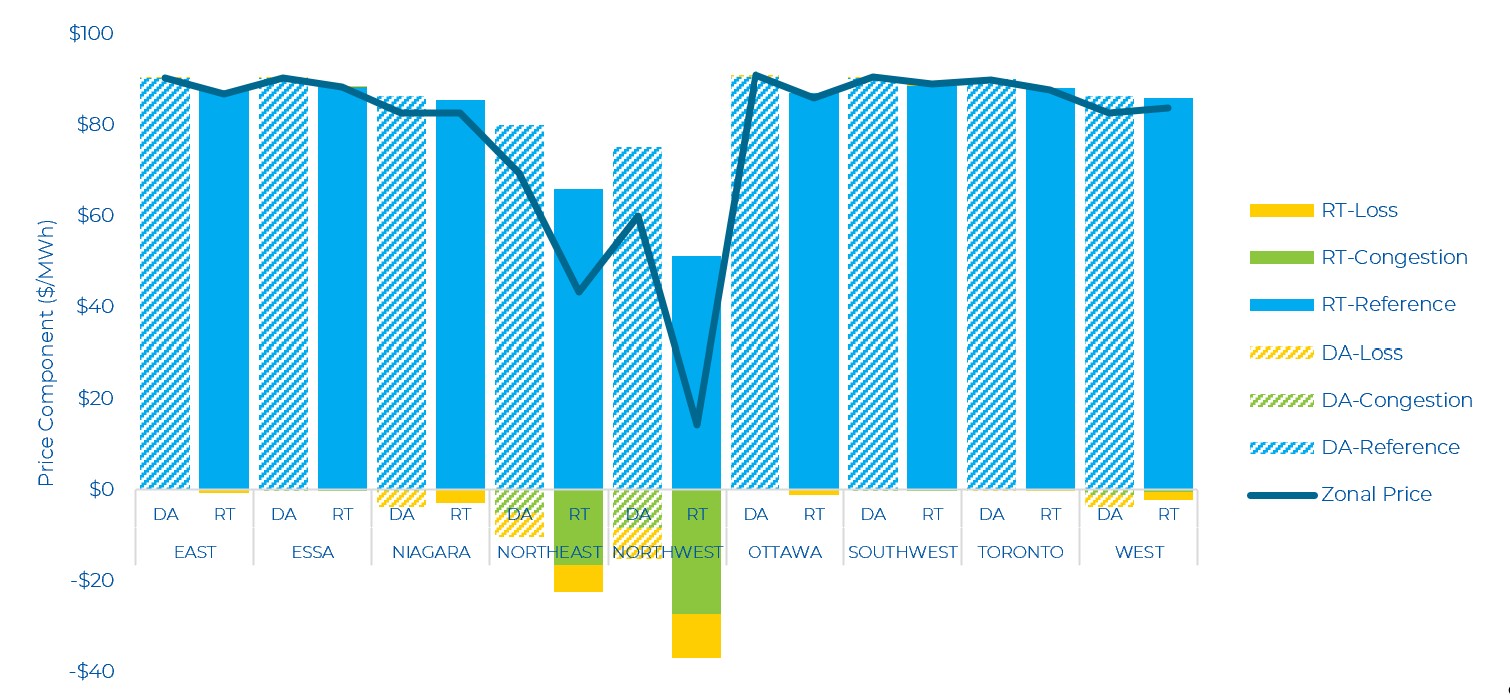
Both the Day-Ahead (DA) and Real-Time (RT) zonal prices increased compared to the previous week. DA zonal prices ranged from $60/MWh (Northwest) to $91/MWh (Ottawa), while RT zonal prices ranged between $14/MWh (Northwest) and $89/MWh (Ottawa). In both the Northeast and Northwest zones, congestion and losses increased in RT as compared to DA.
The DA and RT price by zone and by component for the past week is shown below.
Day-Ahead and Real-Time Prices
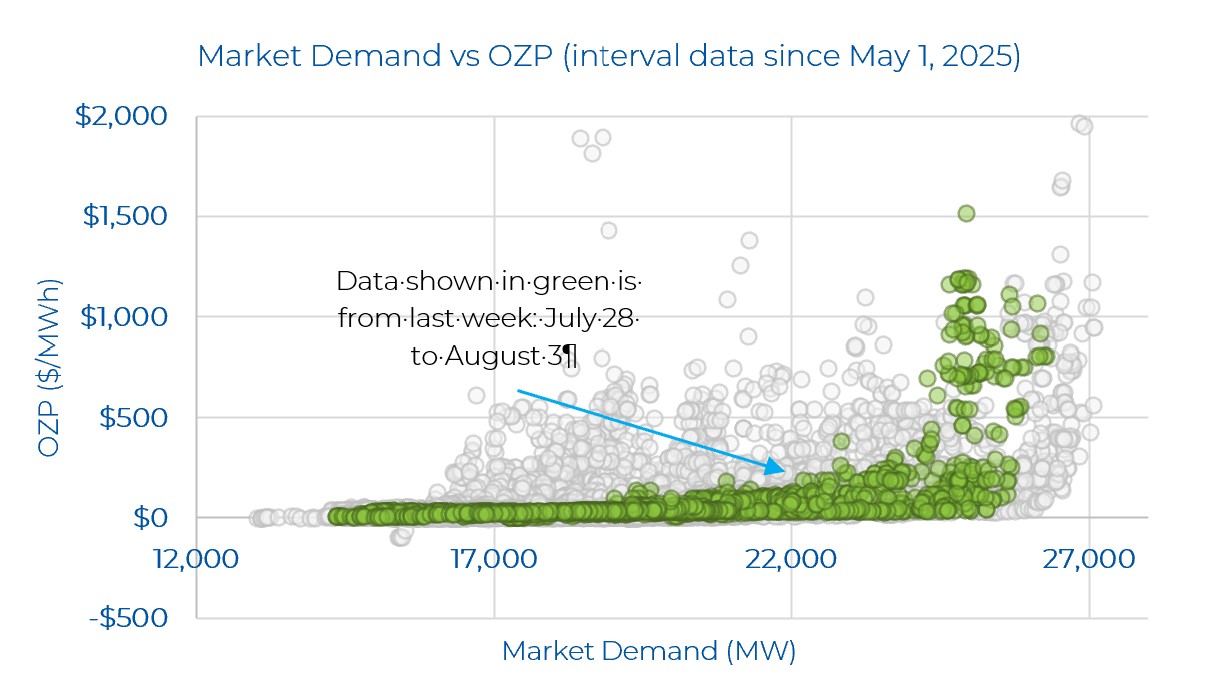
In the graph below, Power Advisory highlights last week’s Ontario Zonal Prices (OZP) based on different levels of Market Demand (which is Ontario Demand plus exports). The highest real-time OZP spike since the renewed market launched remains at $1,961.23/MWh and occurred in one of the highest demand days (June 24) when Market Demand and Ontario Demand hit 26,837MW and 24,409MW, respectively. On July 29 in HE 19, OZP hit $1,512.67/MWh in one interval – with Market Demand of 24,937 MW during that interval. Compared to the week prior, there were no real-time OZPs greater than $500/MWh during moderate demand levels (i.e. high real-time OZPs were only observed when demand was quite high – more than about 24,300 MW).
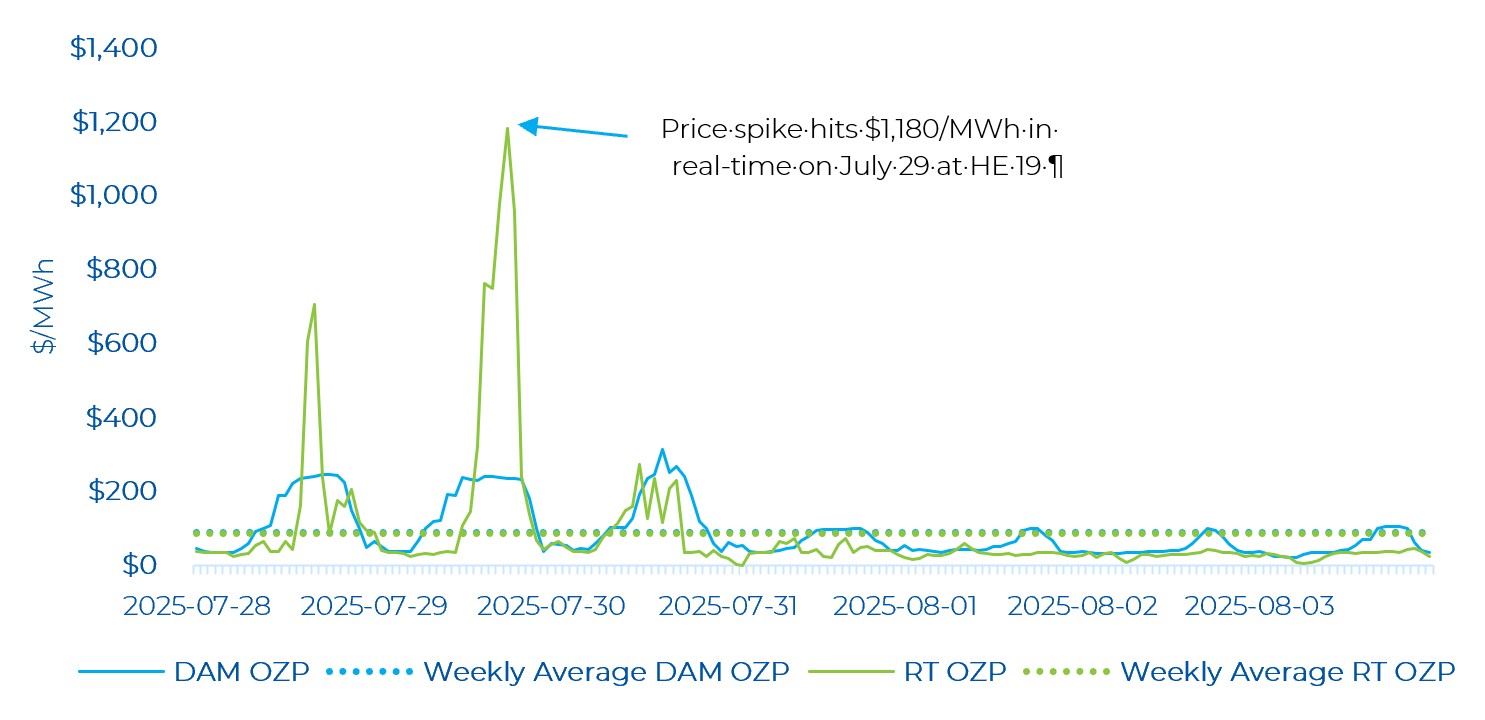
Looking at last week’s day-ahead and real-time prices, real-time energy prices were very volatile at the beginning of the week. There were 15 real-time hourly OZP spikes greater than $200/MWh, with the highest price hitting $1,180/MWh (on July 29). The peak Ontario Demand last week was 24,211 MW (on July 28, HE 16). The peak demand on July 29 – when OZP hit its highest level – was 23,607 MW at HE 18. The two largest price spikes also occurred on July 28 and July 29 – the same days when IESO declared an Emergency State Level 1 advisory notice (see note on first page). The high price was likely a result of ramping constraints, as demand decreased by about 368 MW from the previous hour. The price spikes observed throughout the last week occurred mainly in the evening hours when demand was changing quickly.
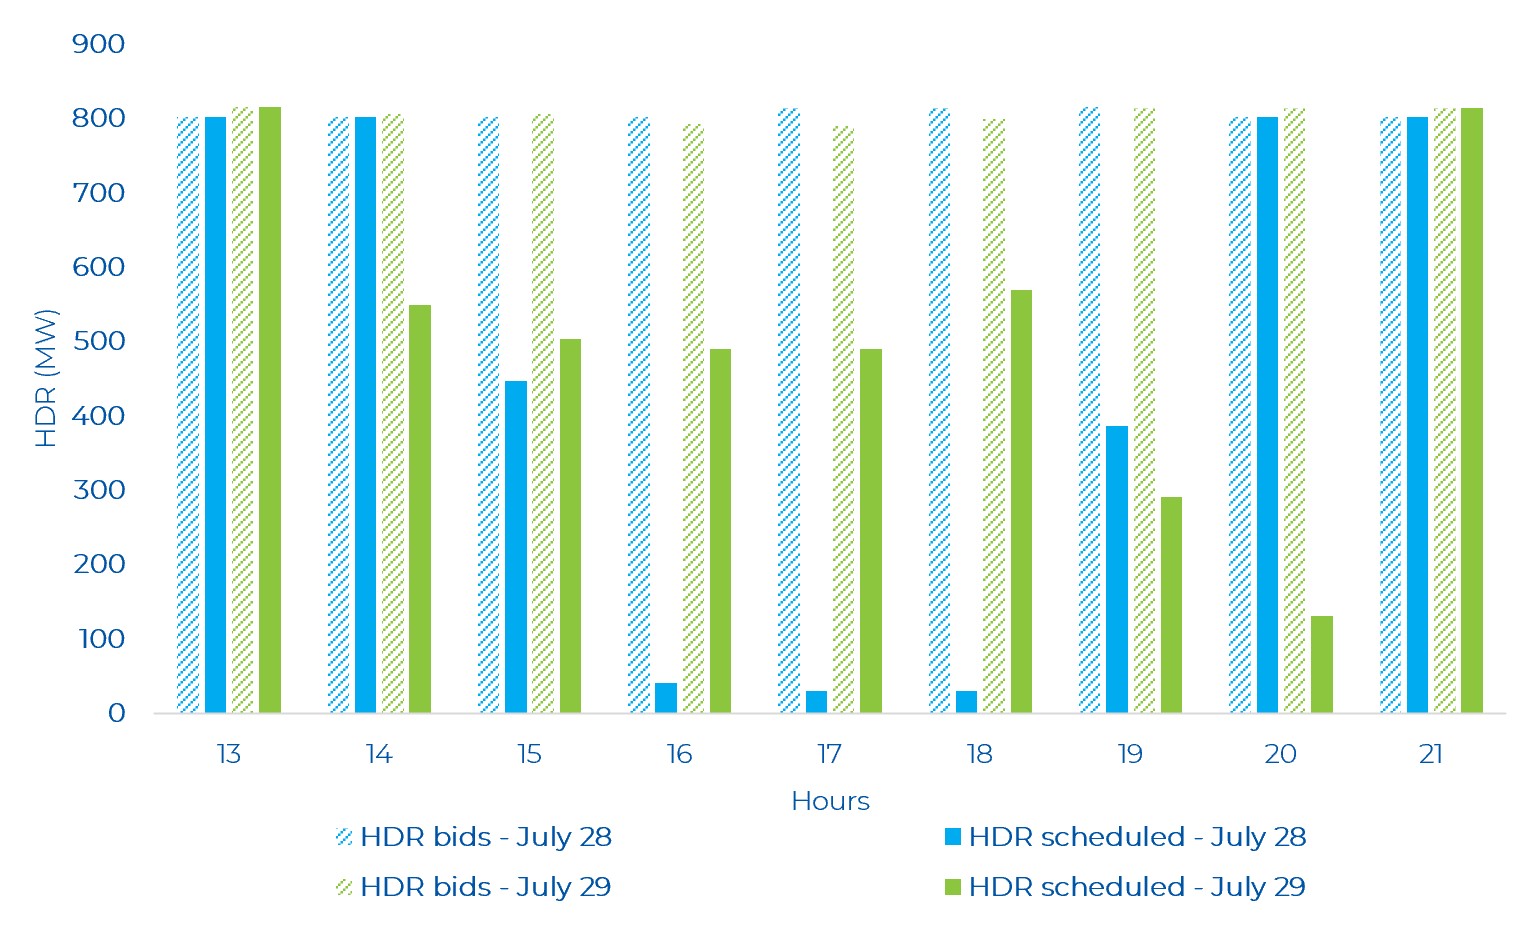
Last week, there were several hours where hourly demand response (HDR) resources were “scheduled on” (i.e., how much of the load got scheduled to reduce demand). HDR was scheduled for several hours between July 28 to August 1. As can be seen in the graph below, focusing on high demand days like July28 and July 29 for HE 13 to HE 21, more than half of the HDR bid ended up with a schedule in many hours – further highlighting the high demand and/or tight supply conditions led to the real-time price spikes observed on these days. In multiple hours, nearly all of the HDR bid into the market was scheduled.
OR Prices
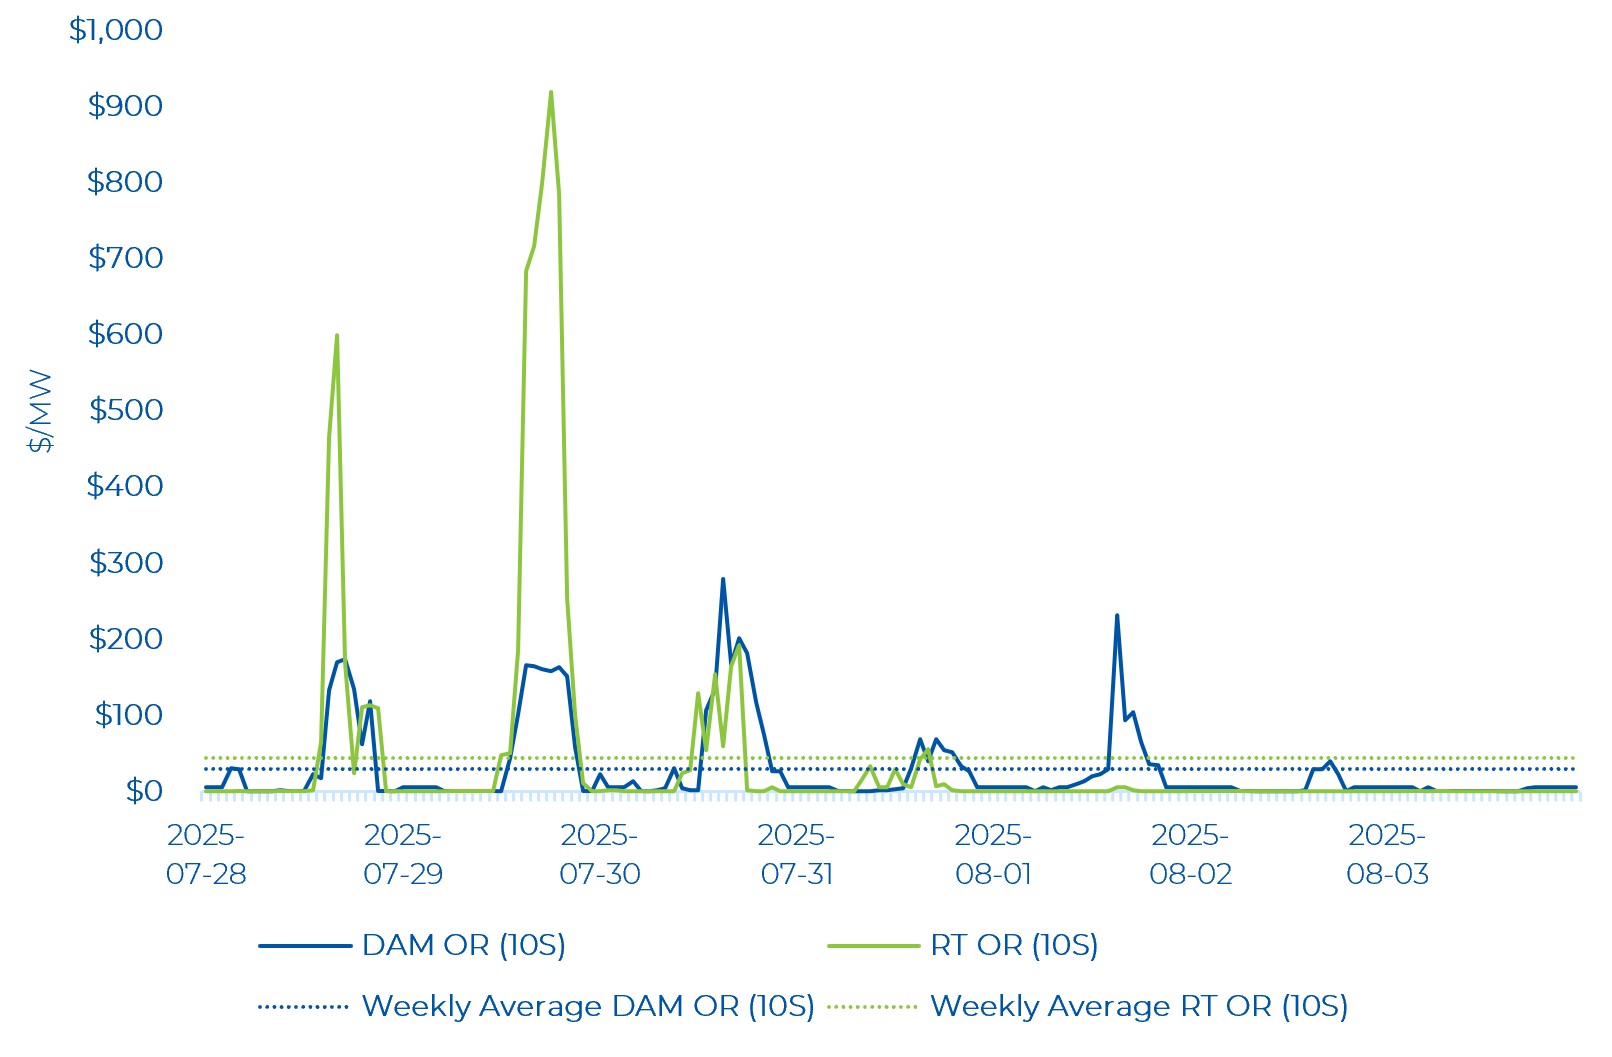
Both real-time and day-ahead Operating Reserve (OR) prices remain elevated compared to historical averages. The average weekly day-ahead 10S price was $29.05/MW, while it was even higher in real-time, at $43.27/MW. Again, this highlights that the supply stack in the OR market remains much tighter in the renewed market compared to the legacy market (as noted in previous commentaries). In conjunction with higher real-time OZPs, higher OR prices are also observed.
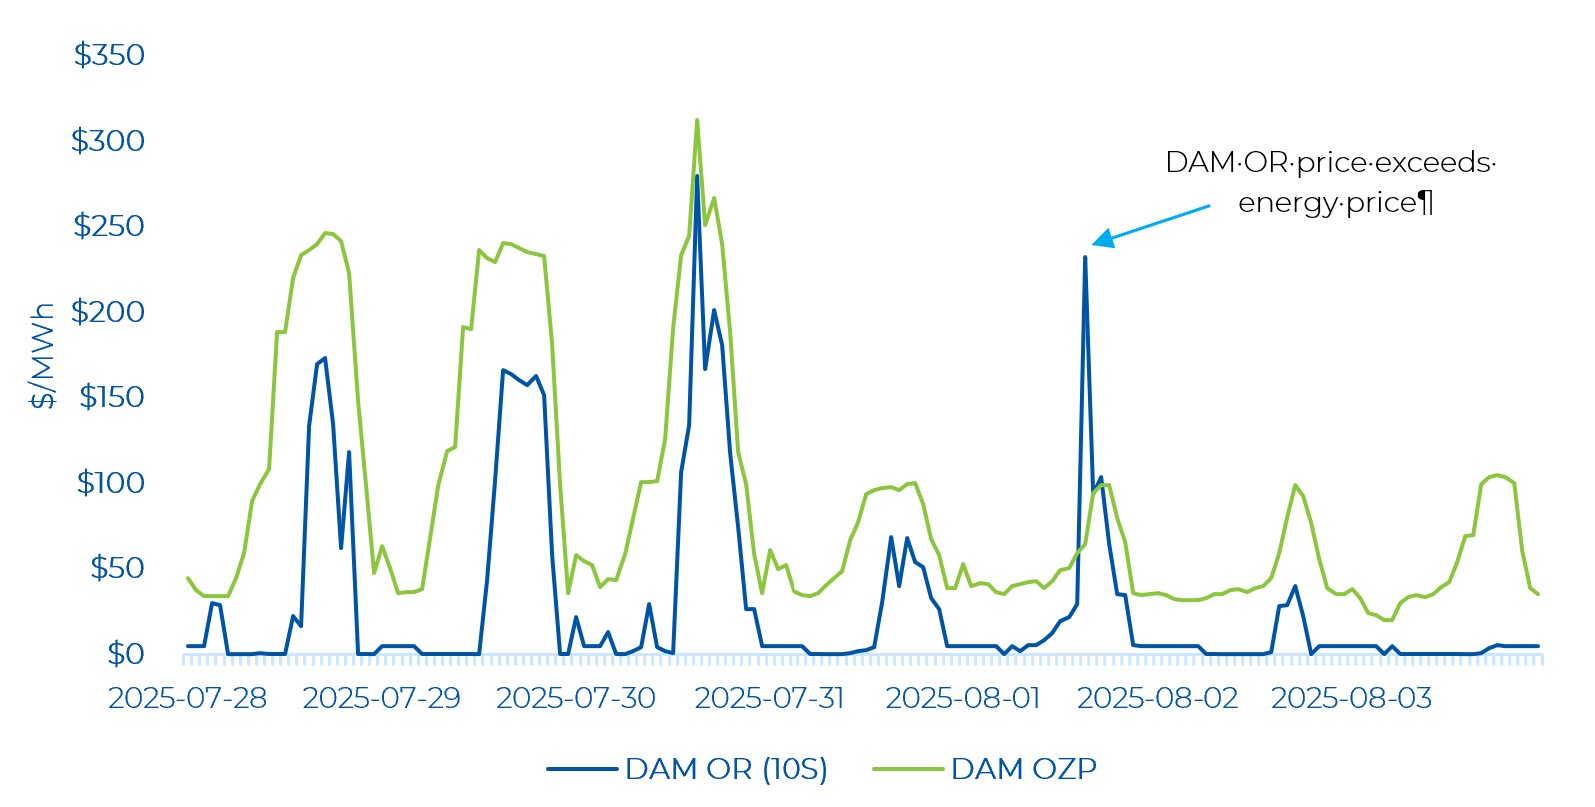
The average hourly DAM OR price remained below the average hourly DAM energy price for nearly all hours of the week – with the exception of HE 16 on August 1. Day-ahead OR prices closely tracked the trend in energy prices. The highest day-ahead OR price was $279.75/MWh which occurred at the same time as the day-ahead price peak of $245.55/MWh (on July 30 at HE 16).
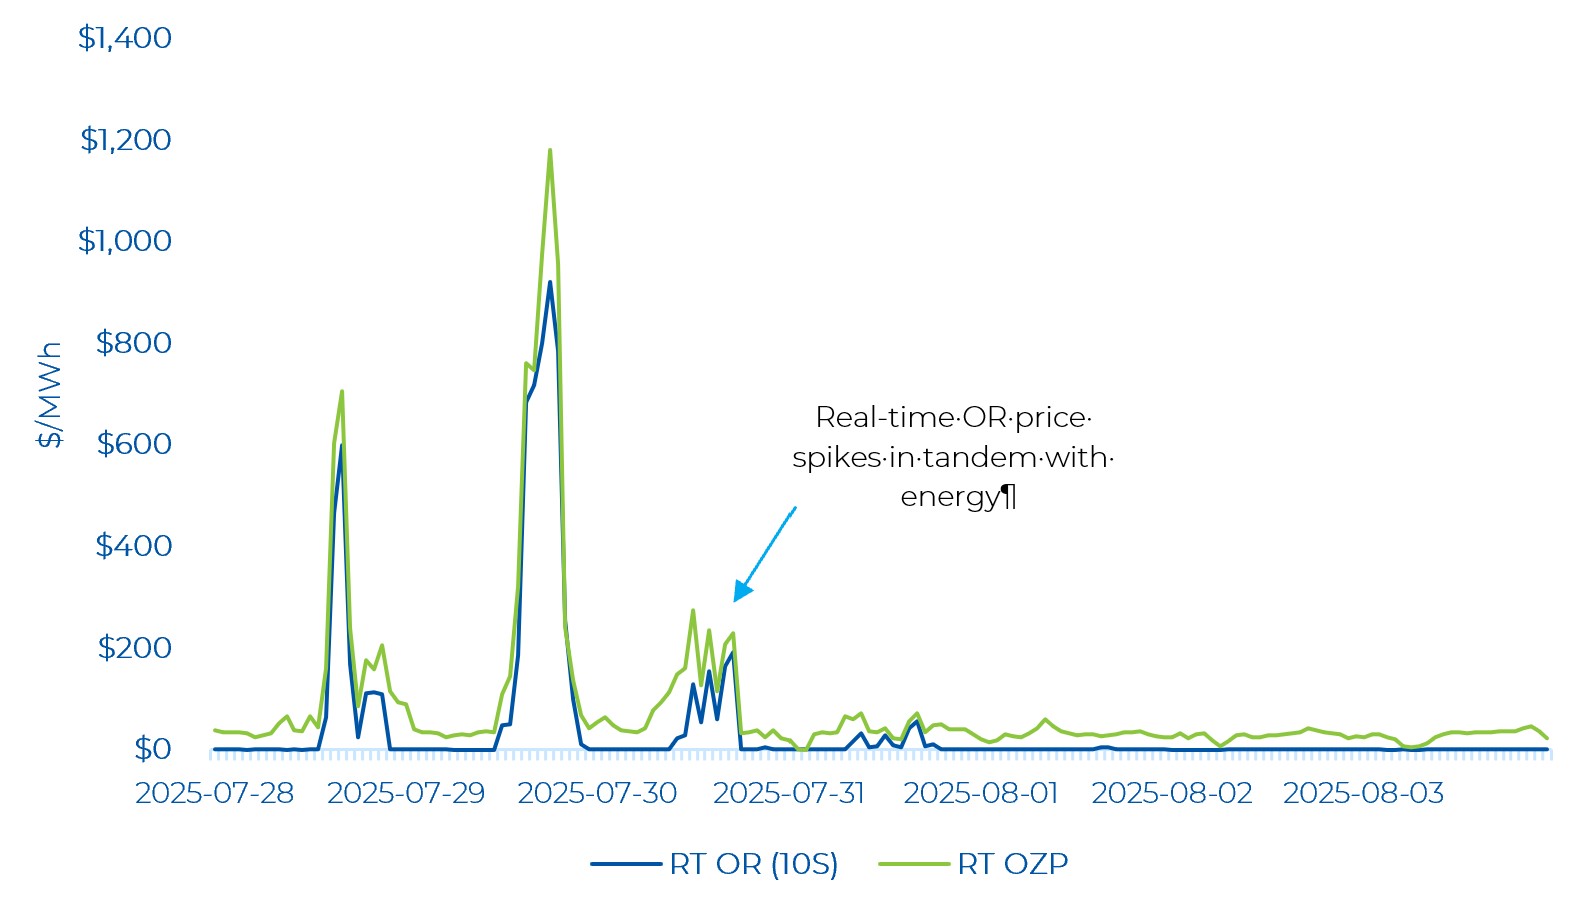
Real-time OR prices were low (i.e., near $0/MWh) for several hours of the week with OR prices exhibiting less volatility compared to energy prices. Real-time OR prices are moving in tandem with real-time OZP. Real-time OR prices reached $919.80/MWh, which occurred at the same time as the real-time price peak of $1,180/MWh.
Zonal Prices and Congestion
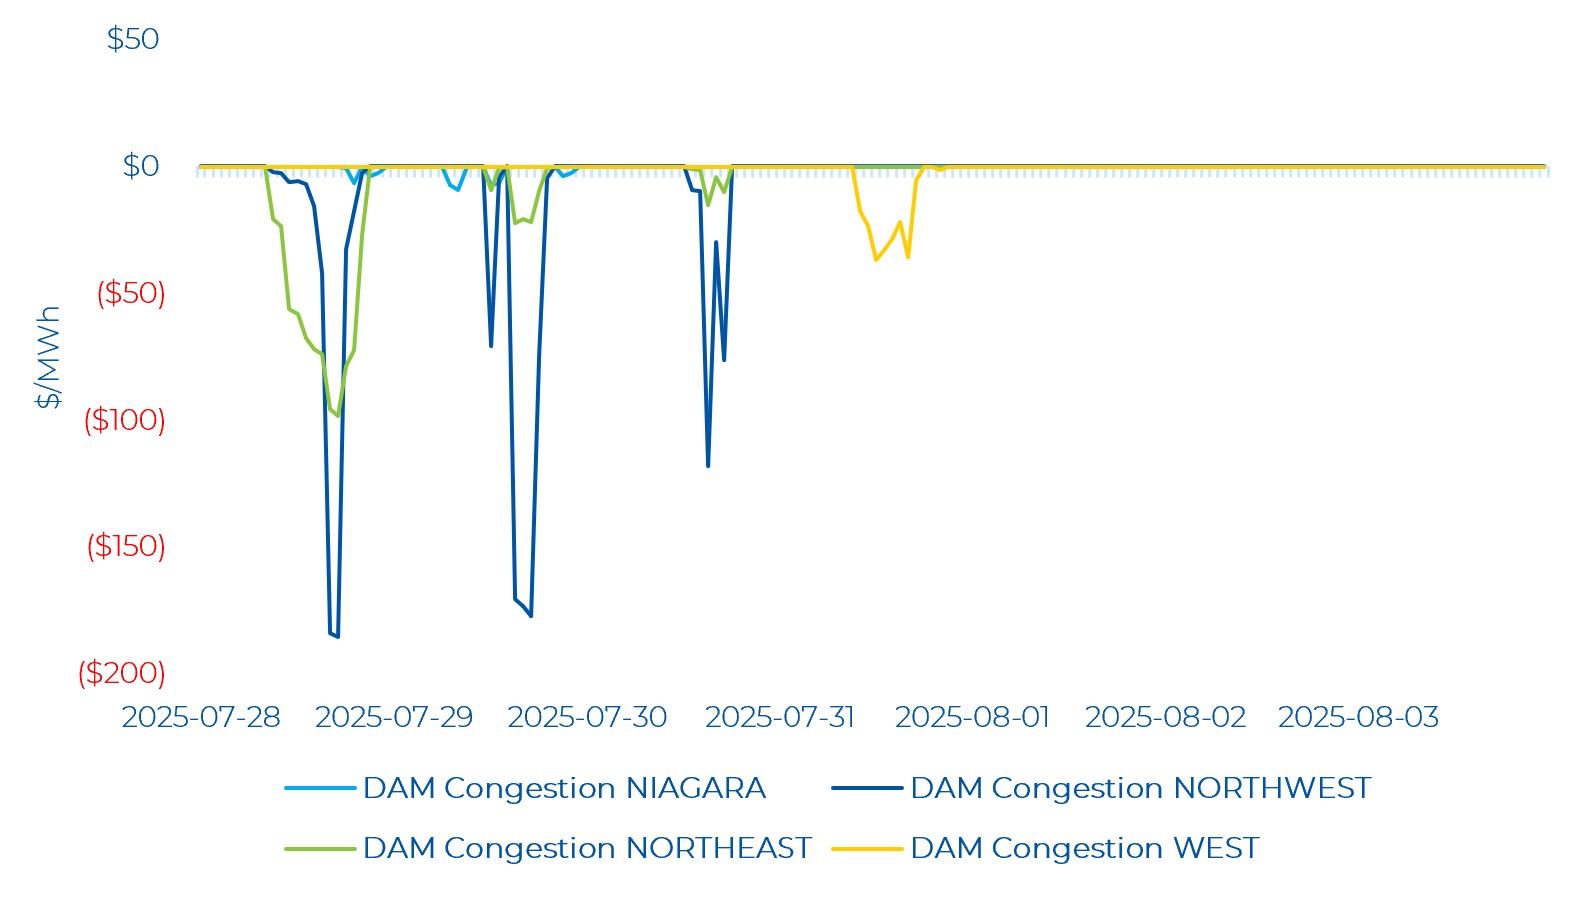
The Northwest and Northeast zones experienced the most congestion in the day-ahead market. The negative congestion in the Northwest and Northeast zone was concentrated on the first three days of the week – coinciding with the highest demand days. Essentially, lower cost energy is “bottled” in the Northwest and Northeast zones and cannot reach the major demand centres in southern Ontario. Congestion in the Northwest and Northeast zones dropped to-$185.63/MWh and -$98.42/MWh, respectively, on July 28 HE 18. The Niagara zone had negative congestion on the first two days, with a low of -$9.27/MWh congestion (on July HE 9). The West zone had negative congestion for most hours between HE 11 to HE 21 on July 31 (lowest being -$36.81/MWh on HE 13).
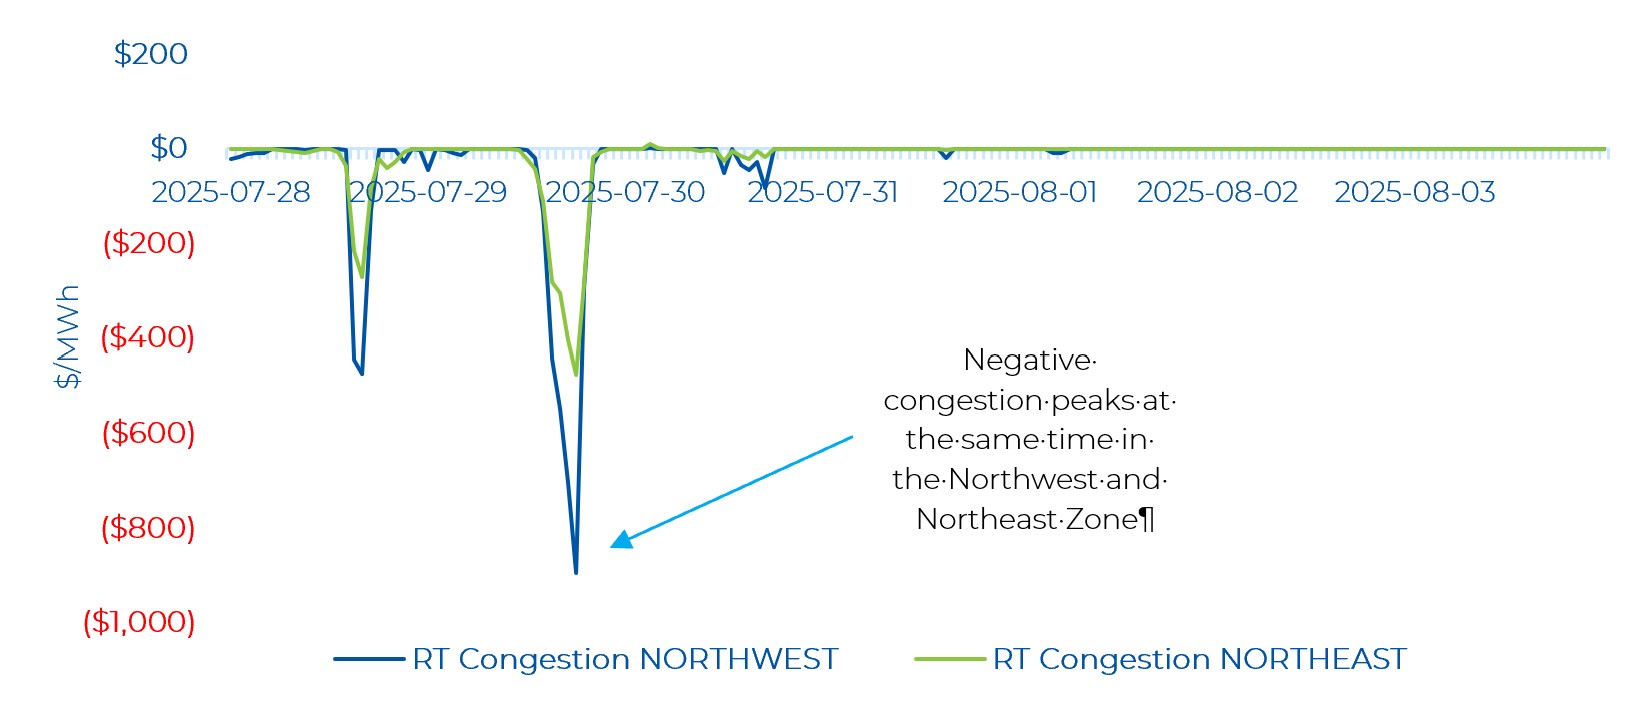
Real-time zonal prices in the Northwest and Northeast remain volatile. Both zones saw negative and positive congestion. The positive congestion occurred HE 4 and HE 5 of July 30, while very negative congestion was observed throughout the first three days of the week with a few hours of negative congestion on July 31 and August 1. Coincident with the highest real-time OZP peak observed last week on July 29, the Northwest zone saw the most negative congestion of -$893.30/MWh while in the Northeast congestion dropped to -$475.50/MWh.
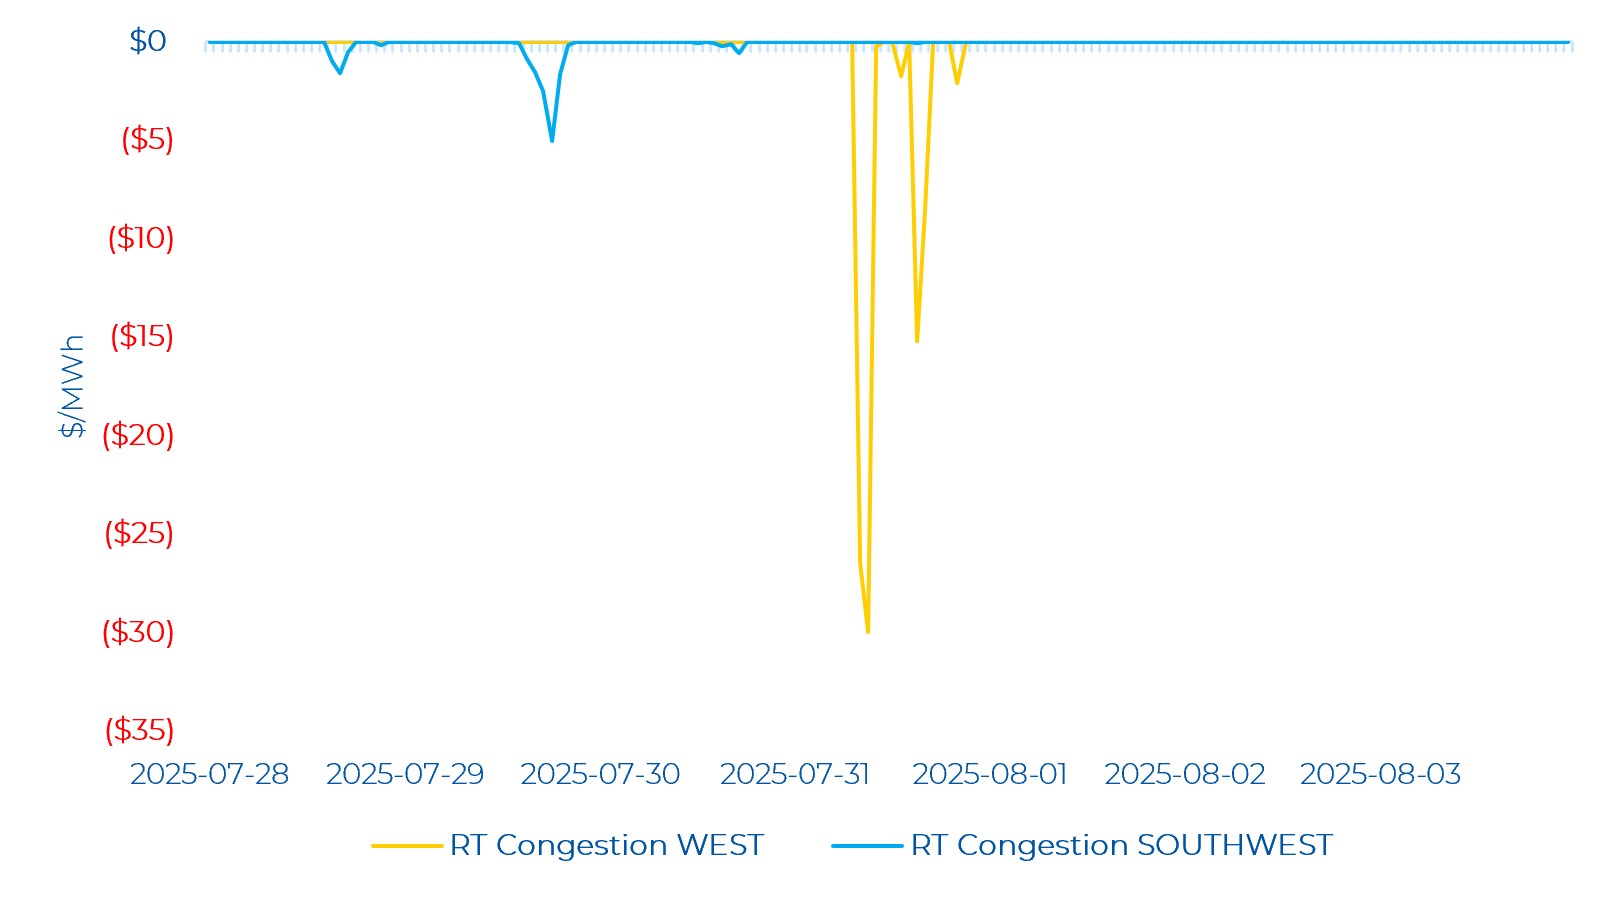
There was also negative congestion in the West and Southwest zones in real-time. The West zone saw negative congestion on seven hours of July 31 from HE 9 to HE 21, with congestion hitting a low of -$30/MWh. There was also congestion (less) in the Southwest zone. The Southwest zone saw a low of -$5.07/MWh of congestion coincident with the RT OZP peak. Minor negative congestion in the Southwest zone was also observed on the first day of the week.