On August 10, 2025, the IESO issued an “Energy Emergency Level 1” advisory notice. The notice stated that starting on August 10 at 16:00 EST and ending on August 10 at 20:00 EST, “The IESO has declared an Energy Emergency Alert Level 1. There is the potential for declaration of an emergency operating state."
Comparing Prices in the Renewed Versus Legacy Market in July
Power Advisory has undertaken a review of energy prices in July 2025 compared to the same month last year to better understand if pricing outcomes in the renewed market broadly align with the legacy market. Based on this review, prices in the renewed market appear to be structurally higher than under the legacy market – at least from the perspective of the underlying marginal cost of a typical price-setting asset in the IESO-Administered Market (IAM).
As we have highlighted in much of our commentary since the renewed market was launched in May 2025, these are preliminary findings, as we expect the IAM – including the underlying Market Rules, Market Manuals and Market Participant behaviour – to evolve over time and result in different pricing outcomes. Nonetheless, we find that looking at pricing outcomes in July – typically a peak demand month in the IAM – provides a solid foundation for observations regarding overall pricing outcomes.
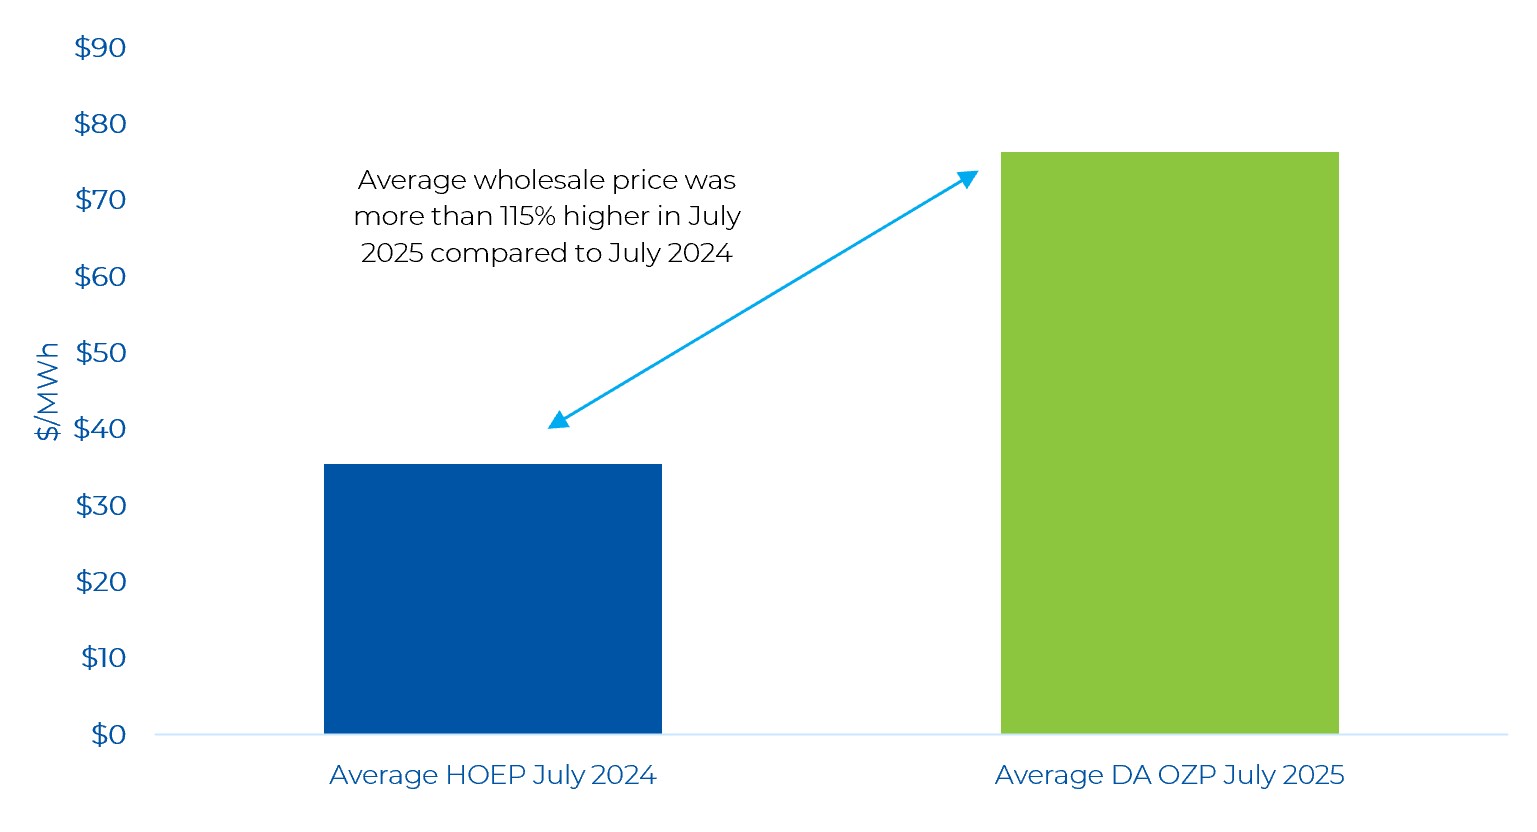
The following graph highlights the change in pricing in the IAM in July 2025 compared to last year – with the average price increasing by more than 115%. We compared the Day-Ahead Ontario Zonal Price (OZP) – the load weighted average price of all of the nodes in the IAM – to the previous Hourly Ontario Energy Price (HOEP), which was the uniform price under the legacy market.
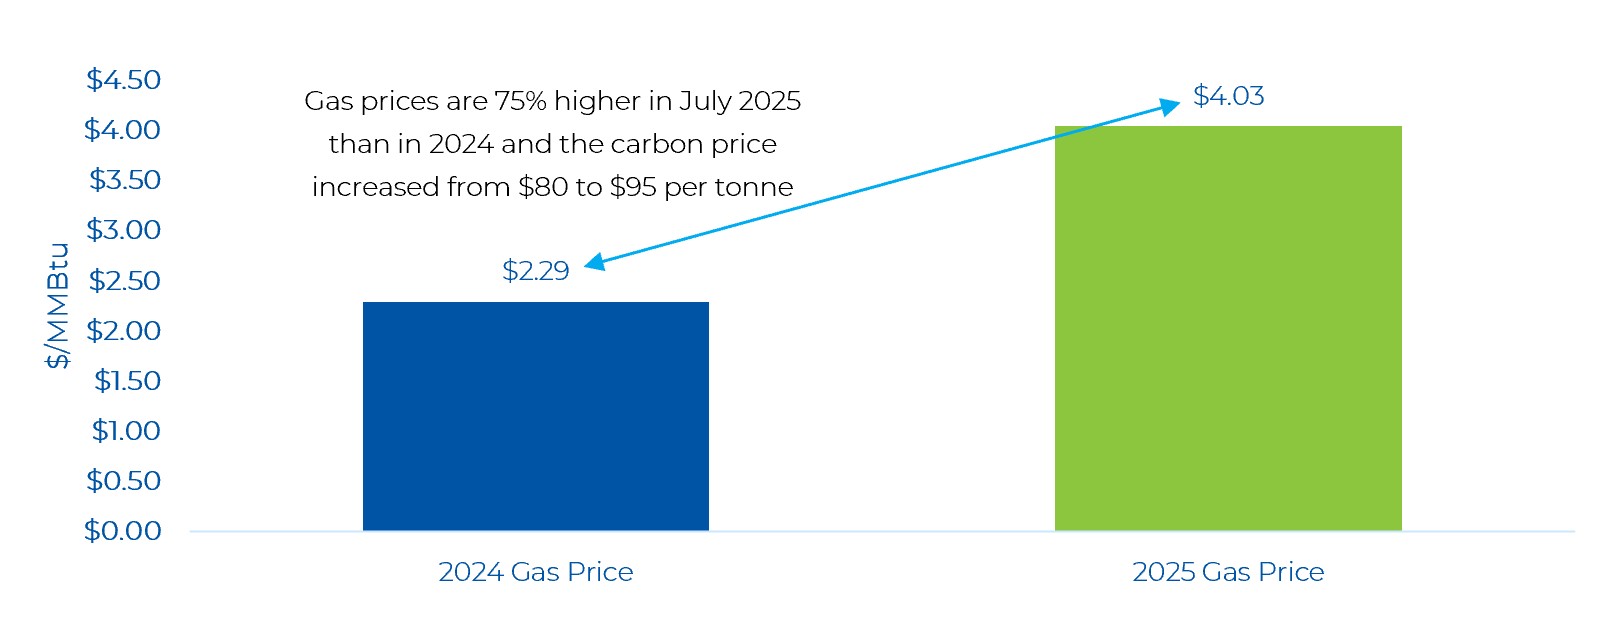
With gas-fired generators typically acting as a price-setting unit – and other resource types offering energy on an opportunity cost based on the marginal cost of gas-fired generation – any increase or decrease in gas prices will have a direct impact on wholesale electricity prices. As can be seen in the graph below, the average gas price was nearly 75% higher in July 2025 compared to a year earlier. Carbon prices – which will also have an impact on the marginal cost of a gas-fired generator – have also increased, moving from $80/tonne in 2024 to $95/tonne this year.
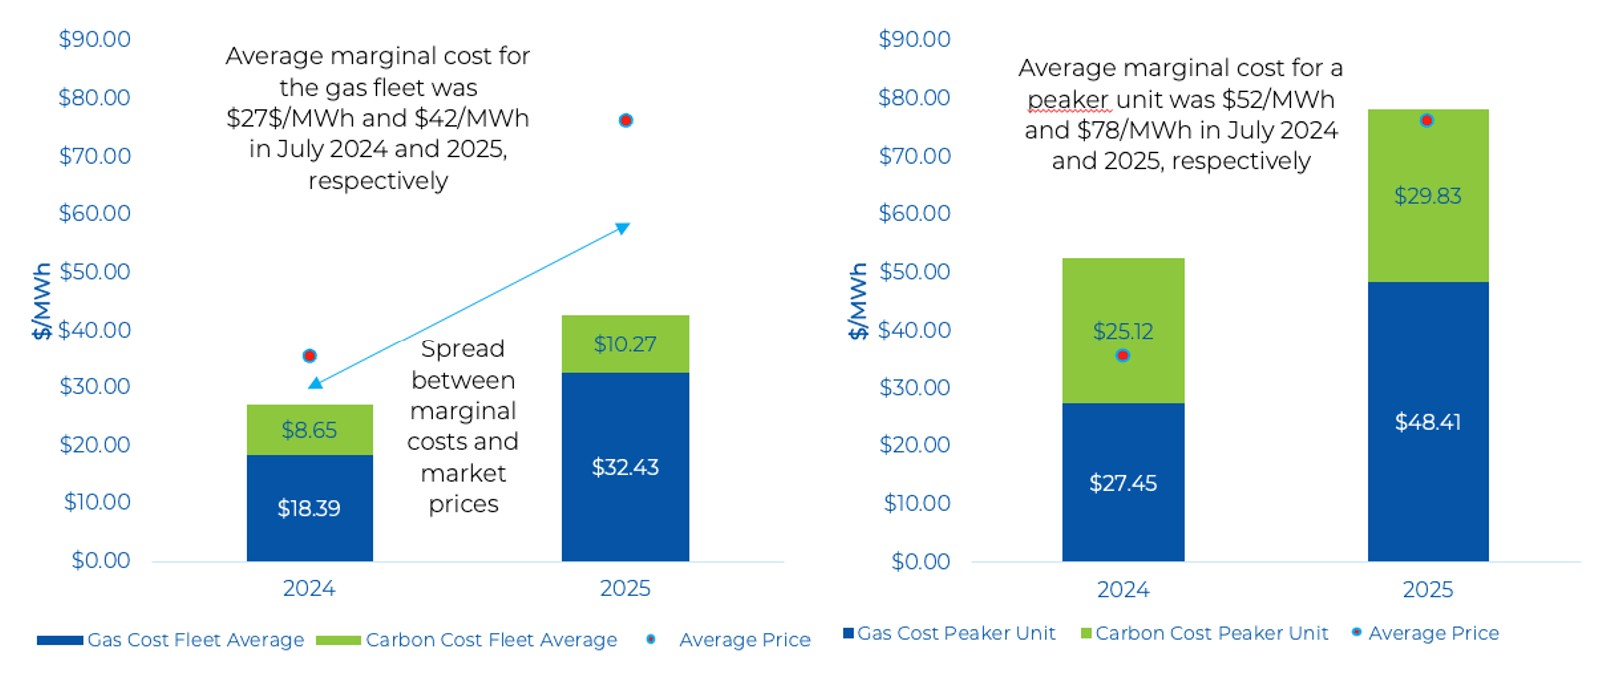
By comparing the increase in natural gas and carbon costs – which underpin the marginal costs of both an “average” gas-fired generator and a “peaker” plant – we can see how different prices were in the IAM in July 2025 compared to last year. In July 2024, the average marginal cost of a gas-fired generator was around $27/MWh, while the average market price was $35/MWh – around an $8/MWh spread. In 2025, the marginal cost of a typical gas-fired generator was $42/MWh, while the average price was $76/MWh – marking a spread of more than $34/MWh. The graph below shows a similar calculation for a “peaker” gas-fired generator, which had marginal costs that were higher than the average price in 2024, but were almost exactly aligned in 2025 (i.e. the peaker’s marginal cost and average price were nearly the same level).
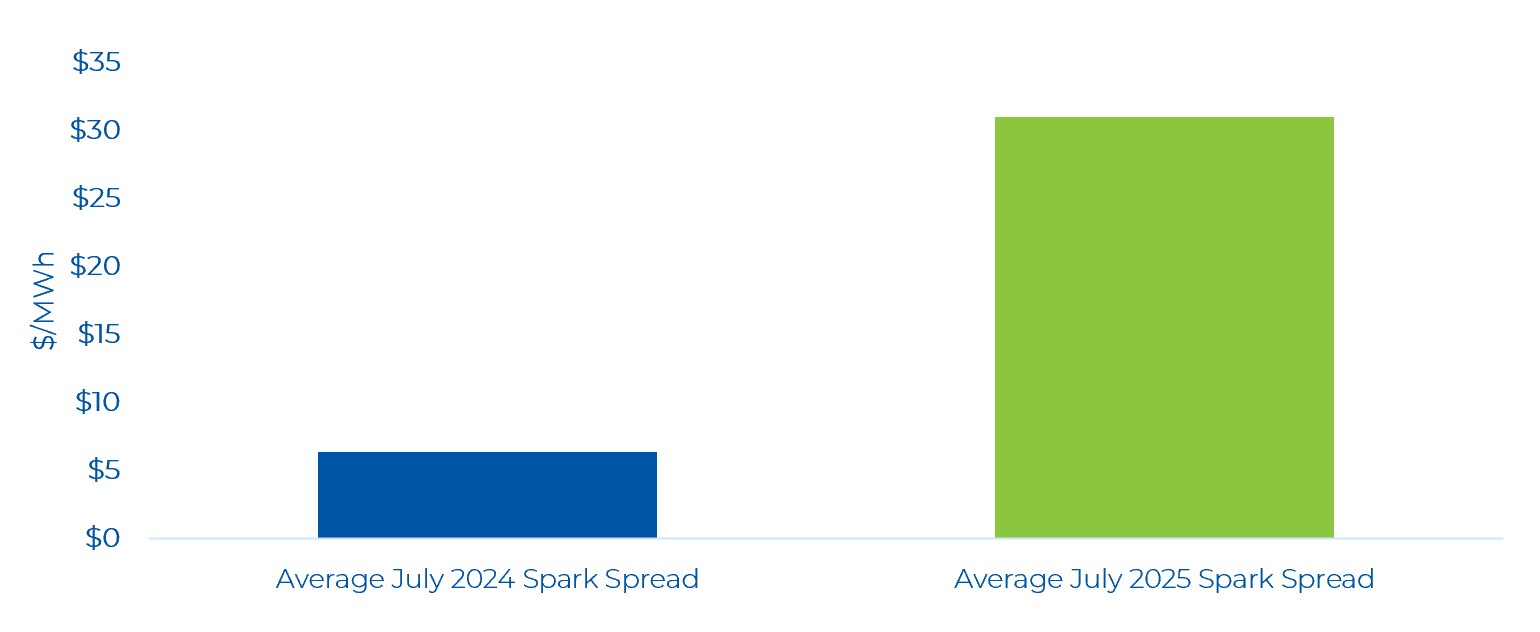
The spread between a gas-fired generator’s marginal cost and wholesale prices is typically referred to as the “spark spread” and is a measure of profitability. The graph below shows how much the spark spread increased in July 2025 compared to a year earlier.
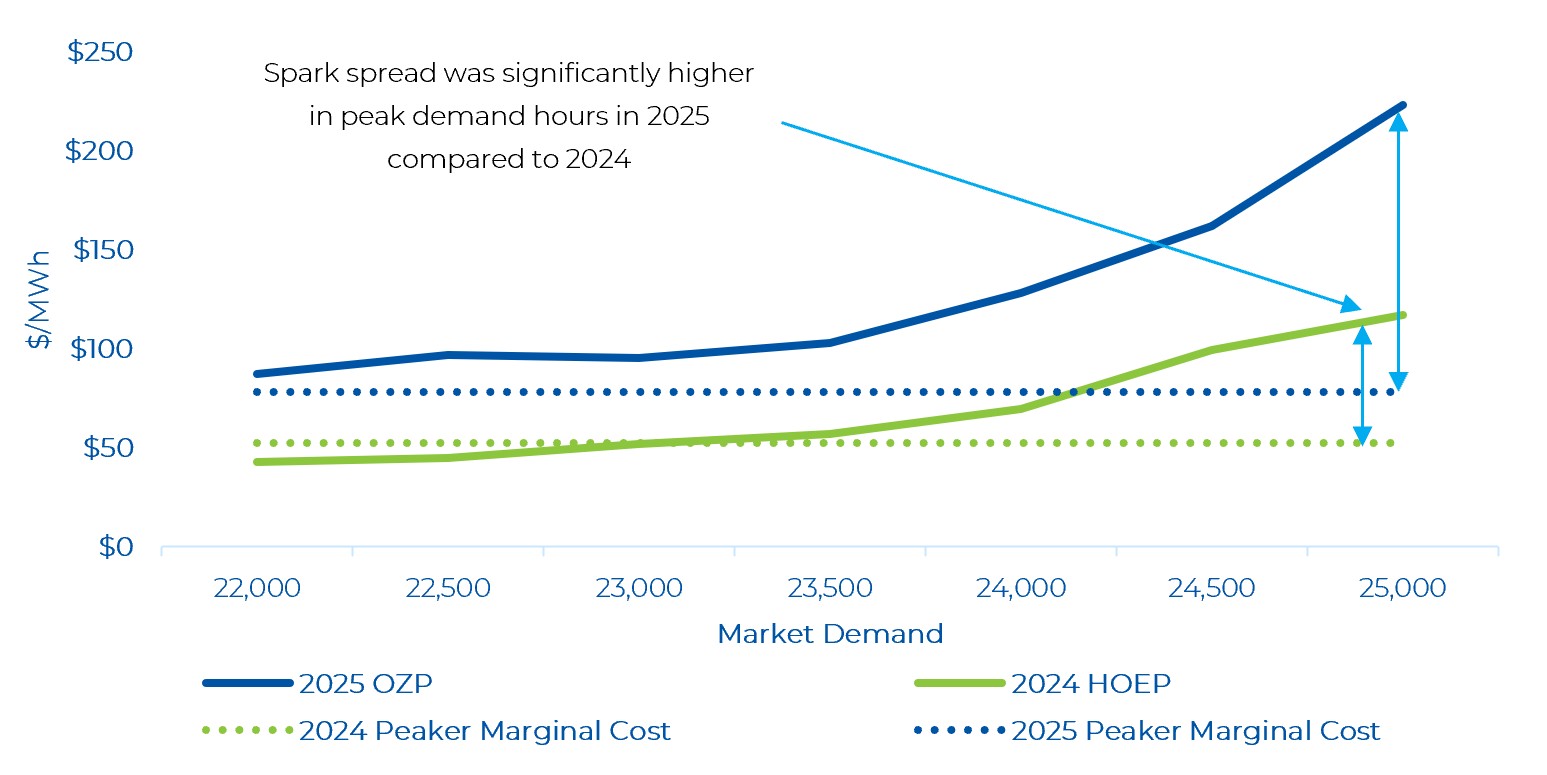
And finally, we compared the spark spread for both an average gas-fired unit and a peak unit based on different levels of Market Demand. As can be seen below, in 2024, a peaker unit was typically profitable when Market Demand was greater than 23,500 MW, while in 2025 the peaker unit was profitable when Market Demand was 22,000. This means that peaker units can be economically dispatched under lower demand conditions.
As noted earlier, the renewed market is still fairly new and it is too early to make firm conclusions. But there does appear to be higher wholesale prices under the renewed market compared to the legacy when comparing prices to the underlying marginal cost of a typical price-setting unit.
Weekly Day-Ahead and Real-Time Price Trends by Components and by Zone
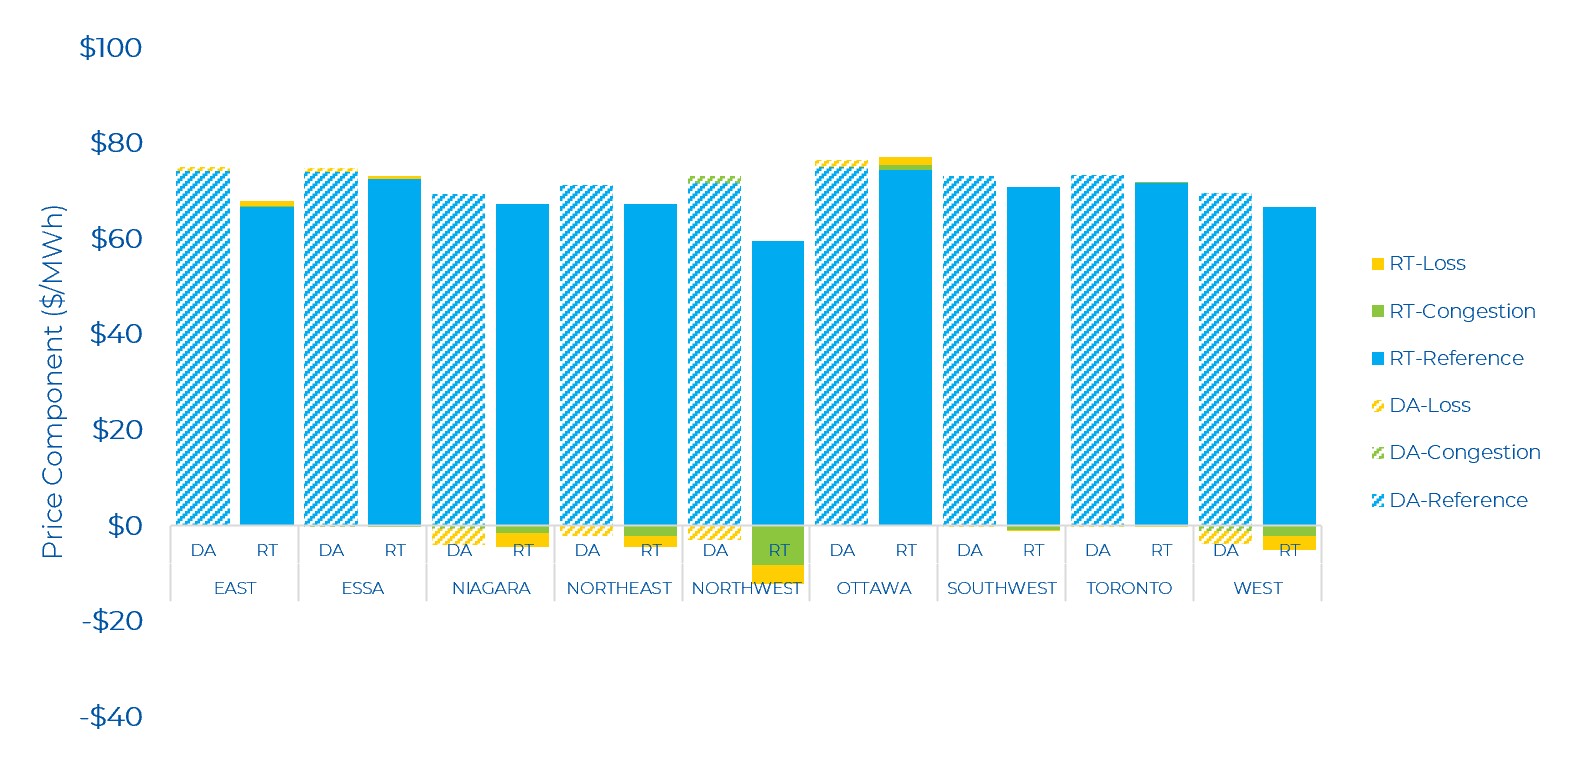
On average, the Day-Ahead (DA) zonal prices decreased compared to the previous week, while Real-Time (RT) zonal prices increased. DA zonal prices ranged from $69/MWh (West) to $75/MWh (Ottawa), while RT zonal prices ranged between $59/MWh (Northwest) and $74/MWh (Ottawa). In both the Northeast and Northwest zones, congestion and losses increased in RT compared to DA.
The DA and RT price by zone and by component for the past week is shown below.
Day-Ahead and Real-Time Prices
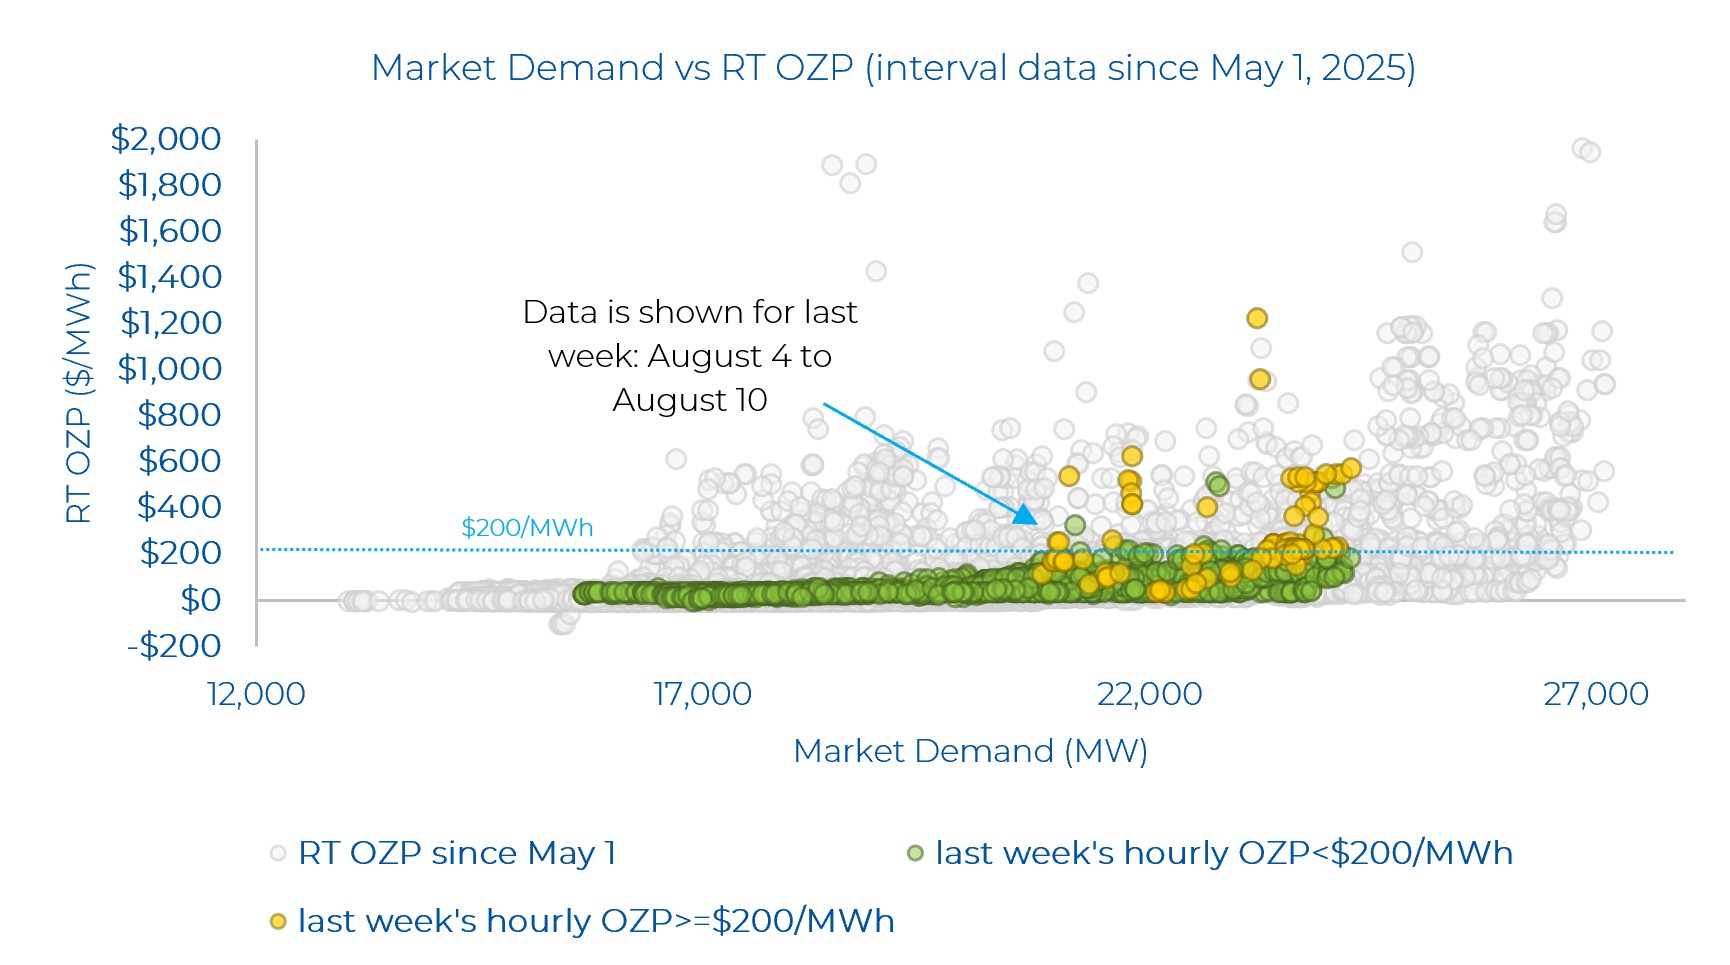
In the graph below, Power Advisory highlights last week’s Ontario Zonal Prices (OZP) in 5-minute intervals based on different levels of Market Demand (which is Ontario Demand plus exports). On August5 in HE 18, OZP hit $1,228.27/MWh in one interval – with Market Demand of 23,205 MW during that interval. Overall, Market Demand was lower compared to the previous week. Last week there were also a few intervals where real-time OZP was greater than $500/MWh even when Market Demand was below 22,000 MW. For hourly prices that exceed $200/MWh, only 66% of the 5-minute intervals actually exceeded that price, meaning that intra-hour changes in price led to far higher and shorter price spikes intra-hour that averaged out to $200/MWh or greater. For example, on August 5, 2025, HE 18 began with OZP at just under $35/MWh and rose as high as $1,228/MWh before returning to just below $52/MWh at the end of the hour, averaging to $284/MWh. Again, this points to the volatility in real-time pricing.
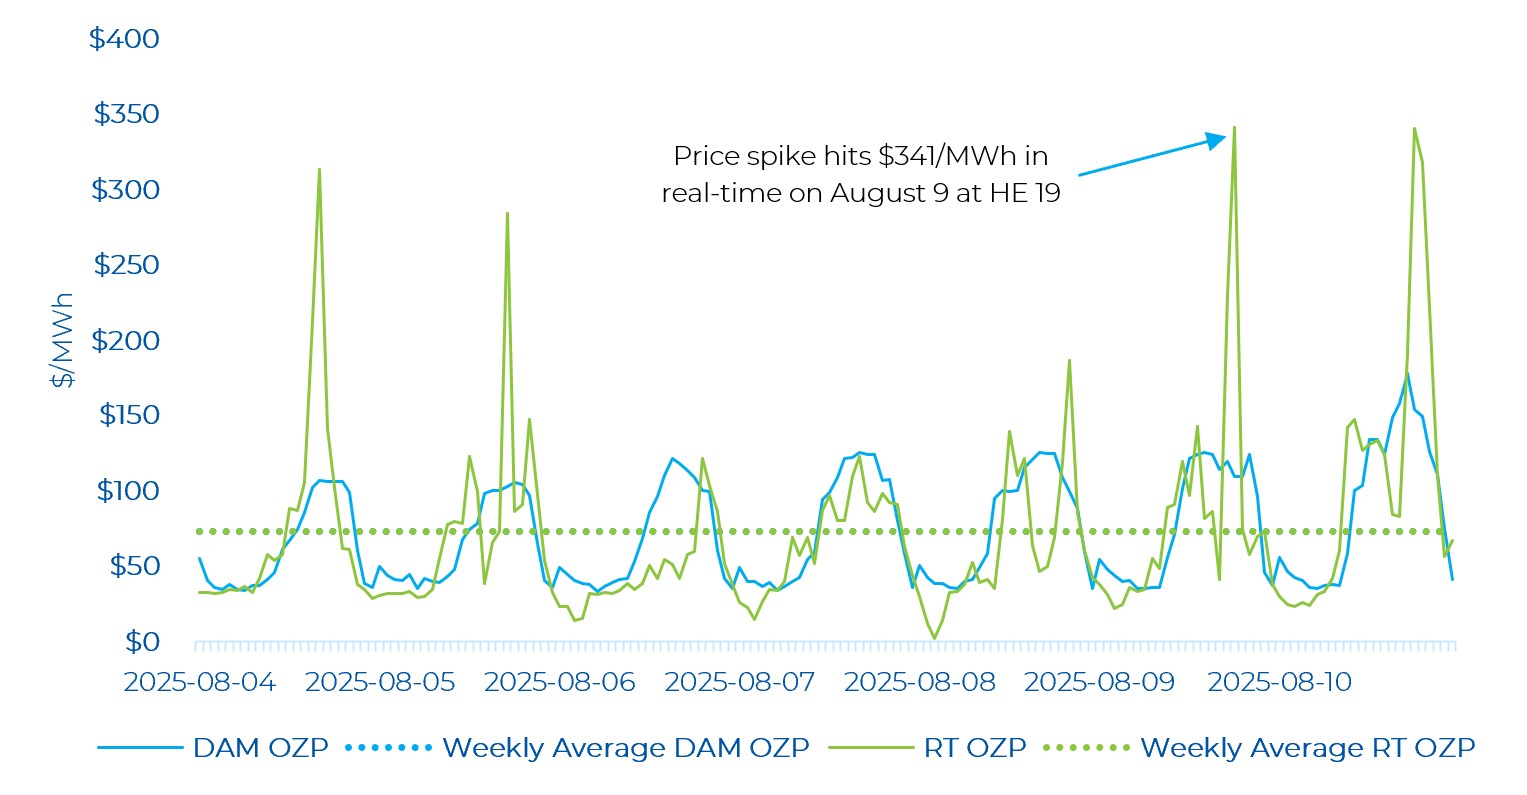
Looking at last week’s day-ahead and real-time hourly prices, real-time energy prices were very volatile throughout the week – but generally lower than the prior week’s OZPs. There were 8 real-time hourly OZP spikes greater than $200/MWh, with the highest price hitting $341/MWh (on August 9). The peak Ontario Demand last week was 24,063 MW (on August 10, HE 18). The peak demand on August 9 – when OZP hit its highest level – was 23,049 MW at HE 19. Three consecutive price spikes in HE 19 to HE 21 occurred on August 10 – the same day when IESO declared an Emergency State Level 1 advisory notice (see note on first page). A similar magnitude in real-time price peaks were also observed on August 4 and August 5.All real-time price spikes occurred near the peak demand hour of the respective day, where in these hours (late afternoon to evening) demand was changing quickly.
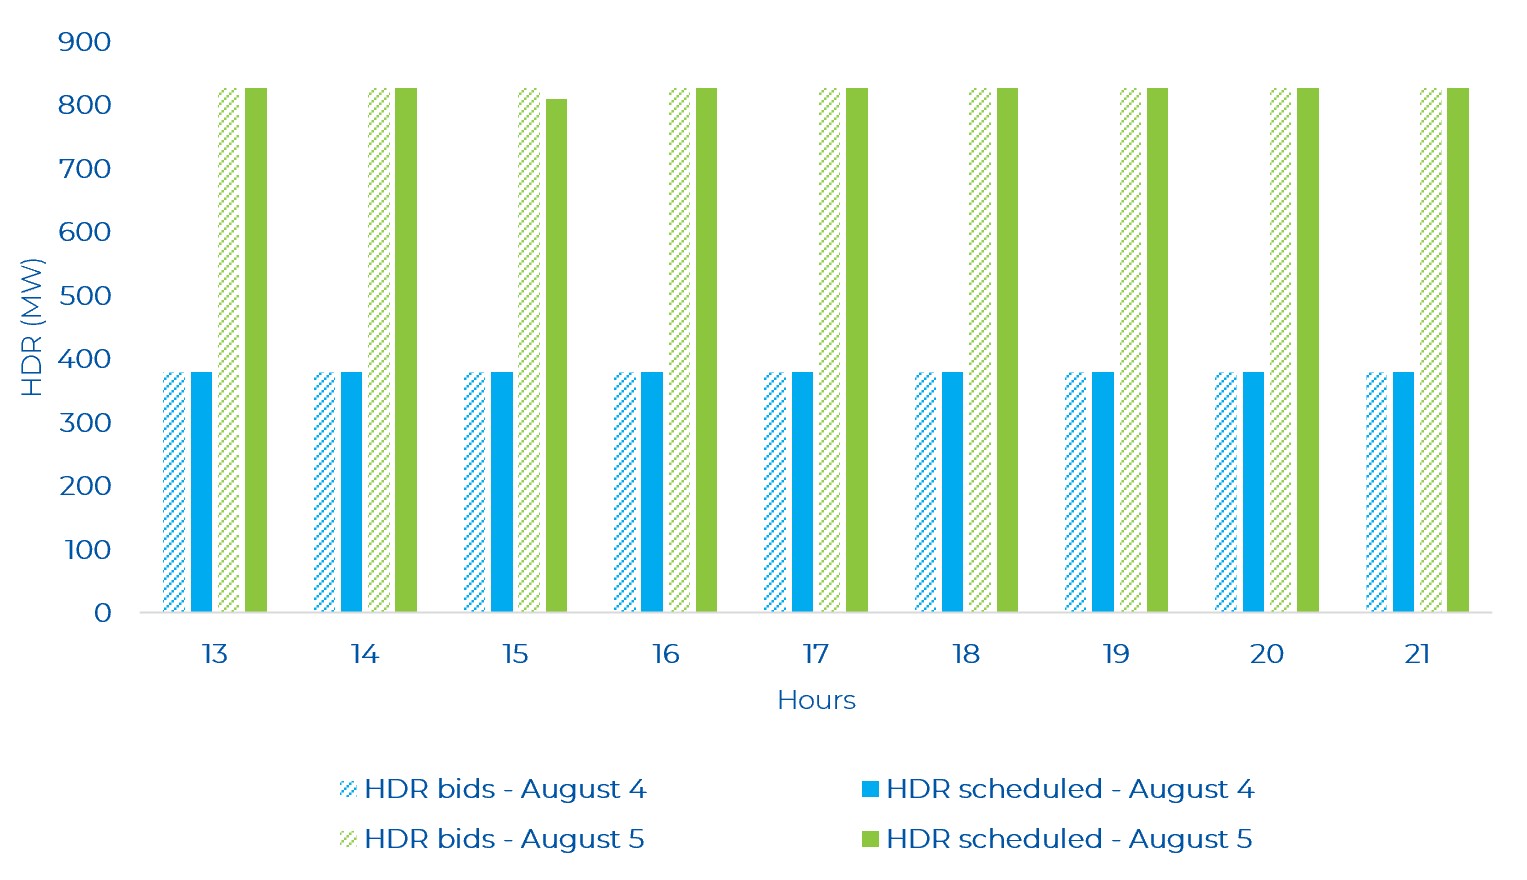
Last week, there were several hours where hourly demand response (HDR) resources were “scheduled on” (i.e., how much of the load got scheduled to reduce demand). HDR was scheduled for several hours between August 4 to August 8. As can be seen in the graph below, focusing on high real-time OZP days like August4 and August 5, all of the HDR bid ended up with a schedule in many hours – further highlighting the high demand and/or tight supply conditions that led to the real-time price spikes observed on these days.
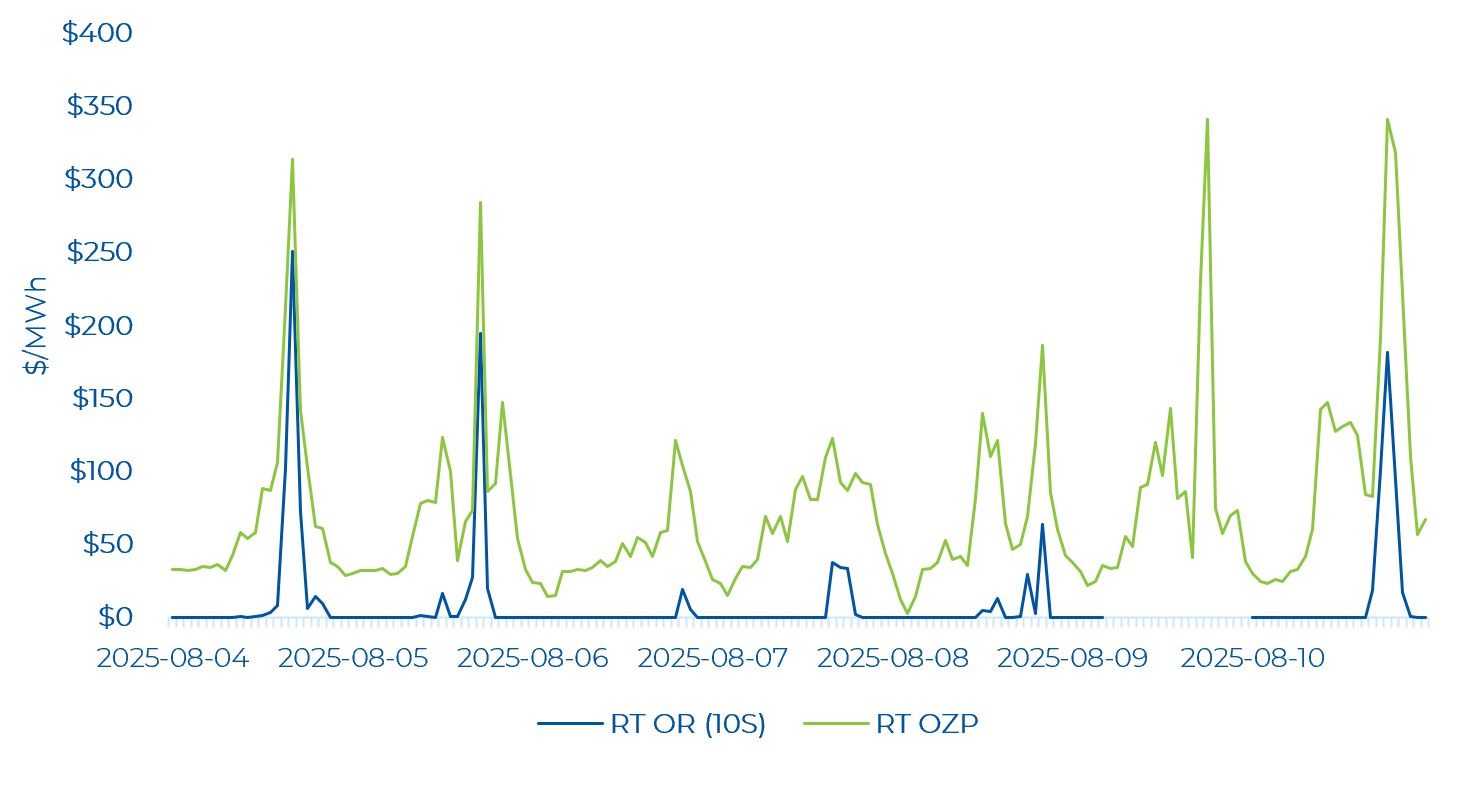
OR Prices
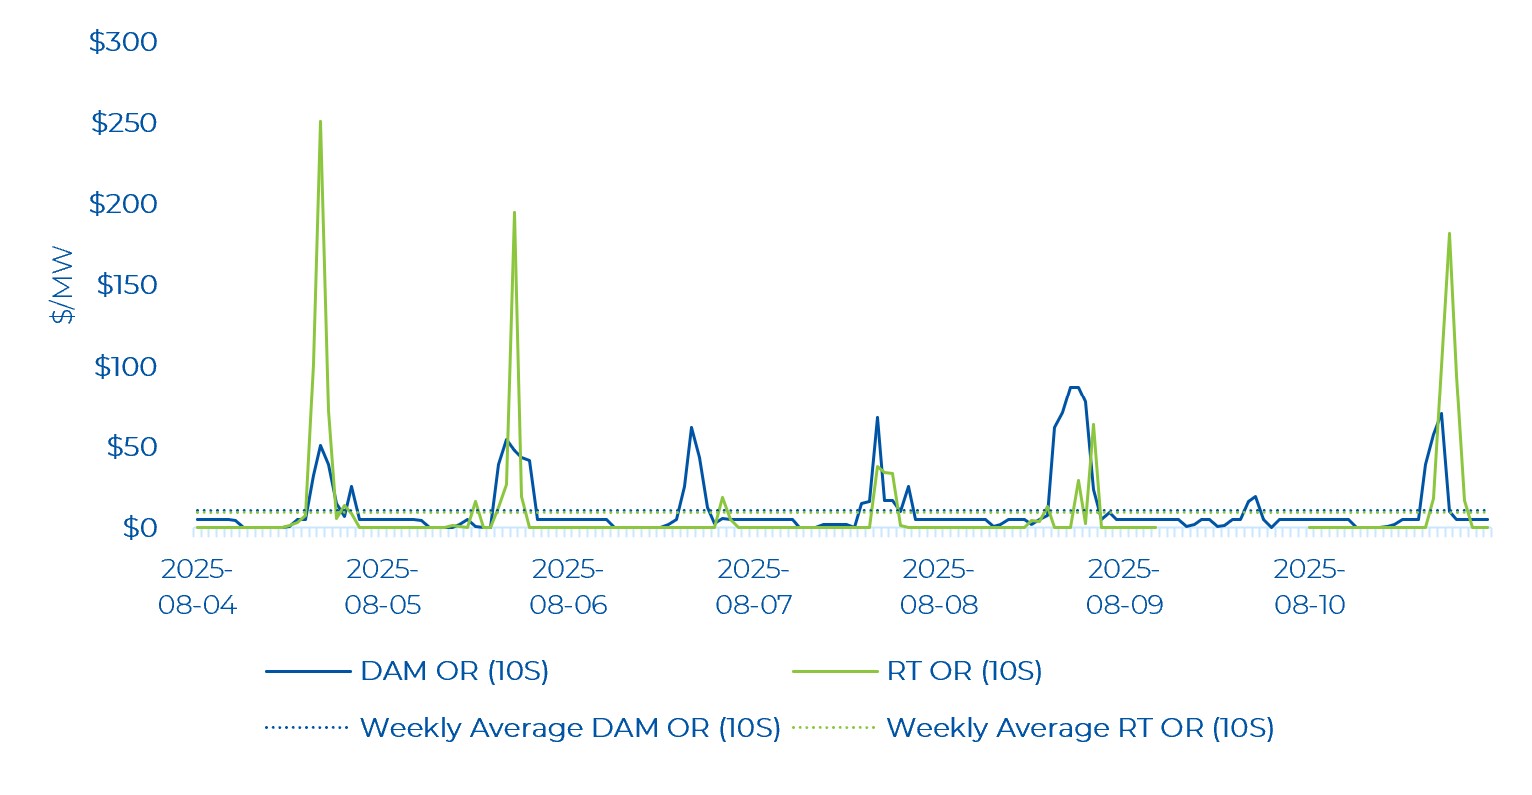
Both real-time and day-ahead Operating Reserve (OR) prices remain elevated compared to historical averages. The average weekly day-ahead 10S price was $10.78/MW, while it was at $9.49/MW in real-time (note this excludes data for August 9 HE 6 to HE 24 as this data is missing). As noted in multiple of our weekly reviews, the OR market supply stack is now tighter than under the legacy market and this has likely been the primary driver of higher OR prices.
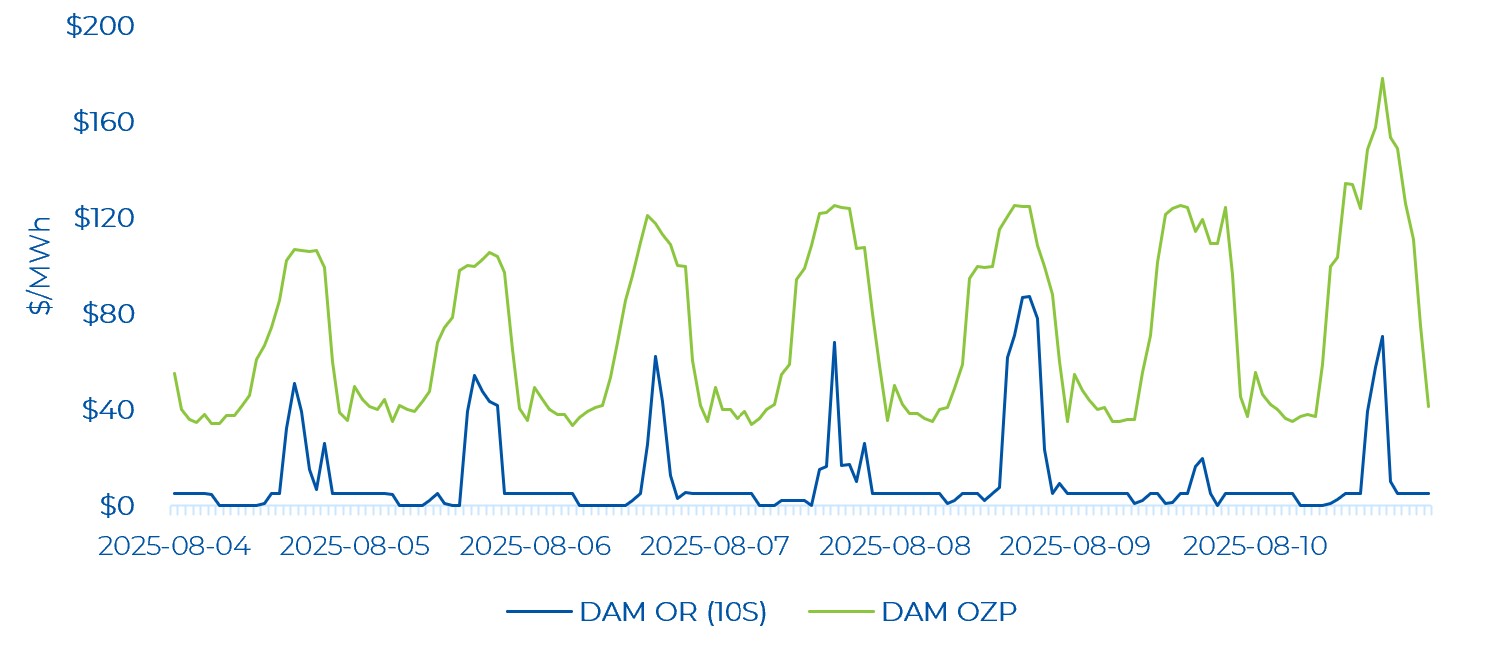
The average hourly DAM OR price remained below the average hourly DAM energy price for all hours of the week. Day-ahead OR prices closely tracked the trend in energy prices. The highest day-ahead OR price was $87.26/MWh which occurred on August 8 HE 19. For reference, the day-ahead energy price was $124.45/MWh at this time.
Real-time OR prices were low (i.e., near $0/MWh) for several hours of the week with OR prices exhibiting less volatility compared to energy prices.
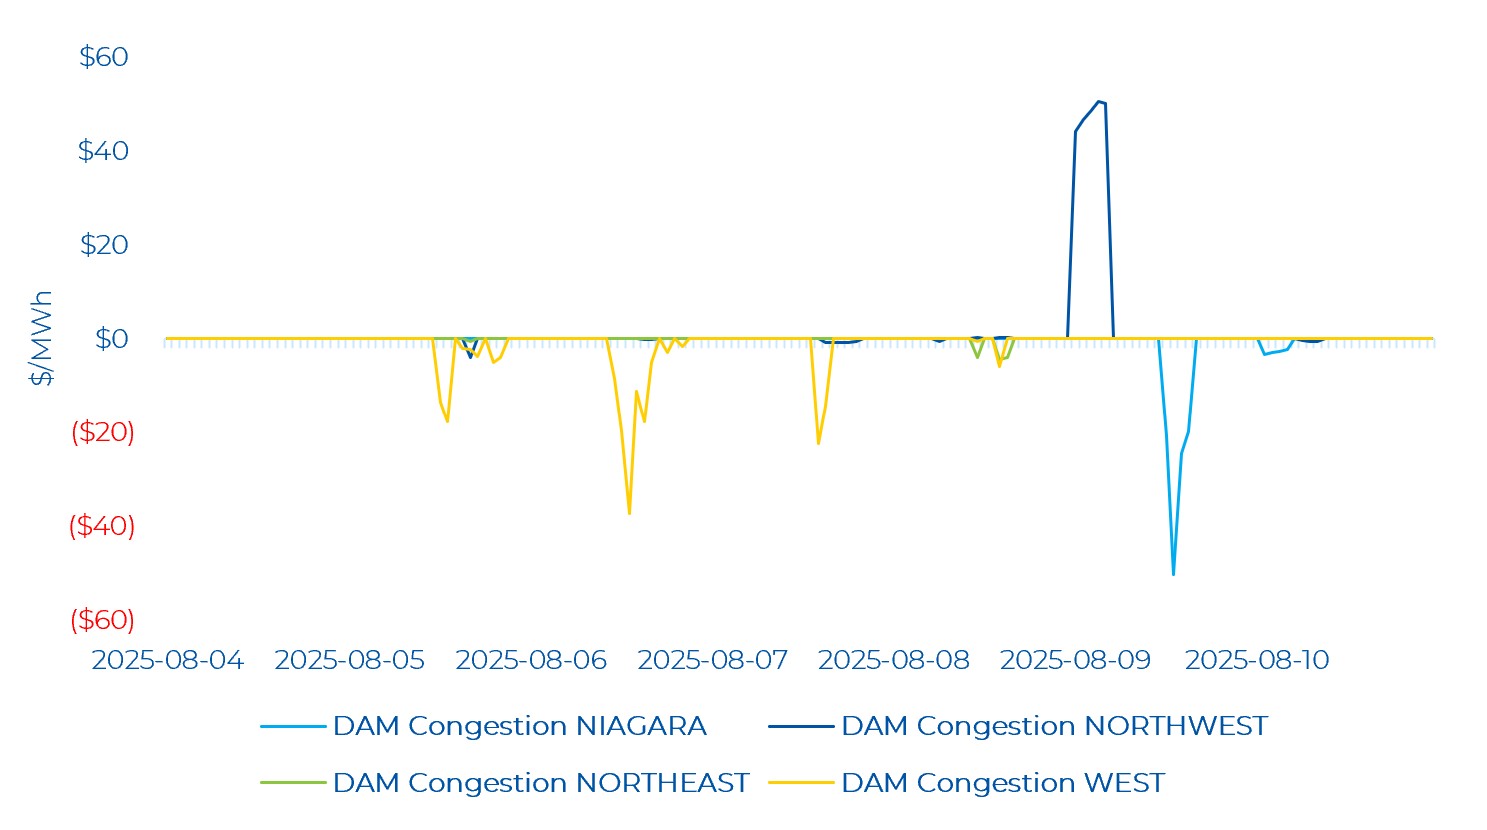
Zonal Prices and Congestion
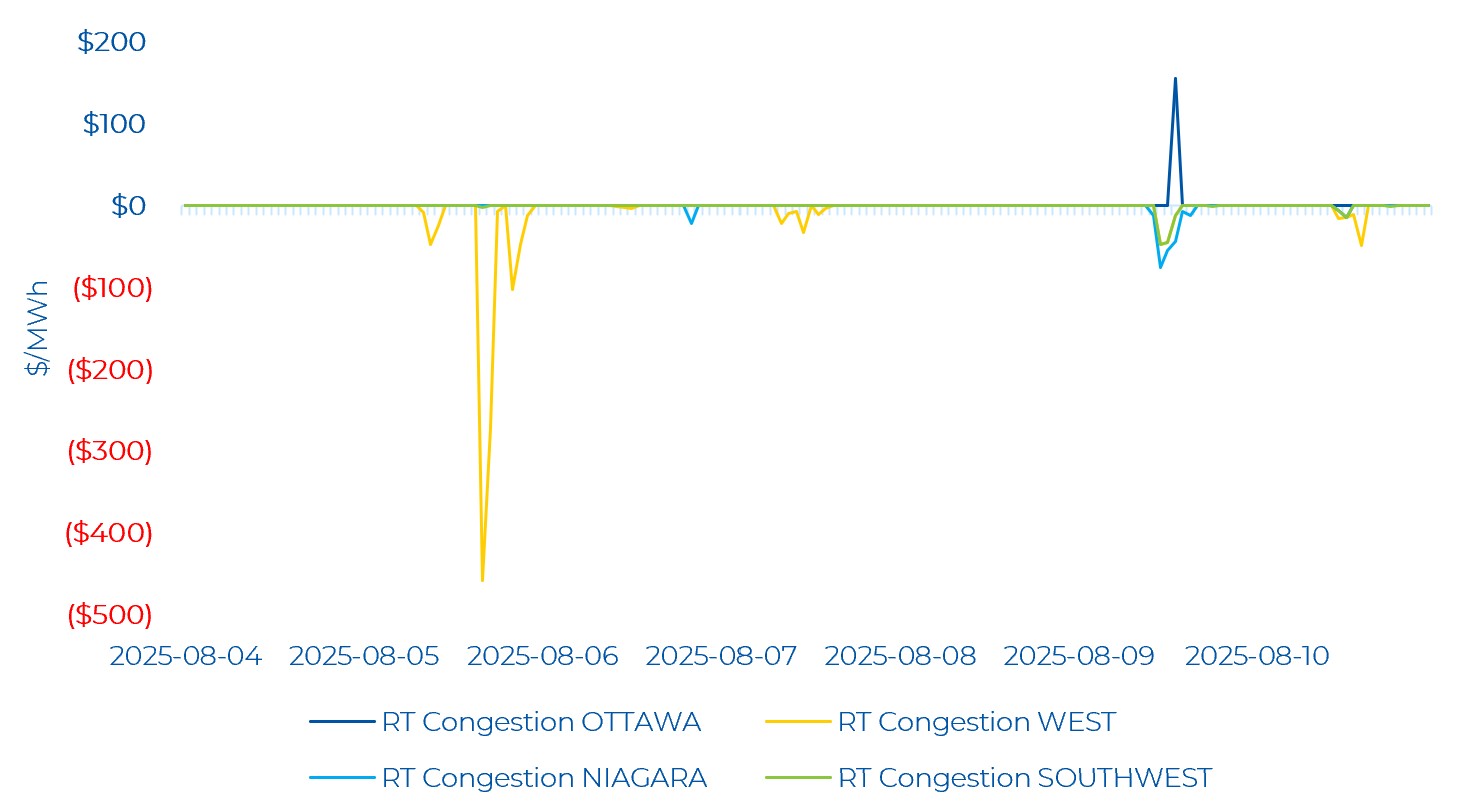
Compared to previous weeks, the Northwest zone saw moderate and mainly positive congestion in the day-ahead timeframe, while the Niagara, West and Northeast zones experienced moderate negative congestion. The positive congestion in the Northwest zone was concentrated on the early morning hours of August 9 with the average congestion in those hours being $47.92/MWh. The West zone saw most of its negative congestion for consecutive hours on August5, August 6, and August 7 with the lowest congestion being -$37.41/MWh (on August 6 HE 16). The Niagara zone had negative congestion on the last two days of the week (also the highest peak demand days of the week), with a low of -$50.38/MWh congestion (on August 9 HE 14).
Real-time zonal prices in the Northwest and Northeast remain volatile – with the Northwest especially seeing large swings from positive to negative congestion. The main positive congestion for the Northwest occurred on August 4 HE 6 to HE 9 and on August 7 HE 19 to August 8 HE 1. Negative congestion was mainly on August 4, August 5, and August 7 to August 10. The lowest congestion was -$365.21/MWh on August 5 HE 17 (with RT OZP relatively low at $73.03/MWh). The Northeast zone saw negative congestion mainly on August 4, August 5, and August 8 to August 10. The lowest congestion was -$109.92/MWh on August 5 HE 17 (coincident with the lowest negative congestion in the Northwest Zone). Essentially, both the Northeast and Northwest zones are seeing materially lower prices close to or during the highest OZP hours.
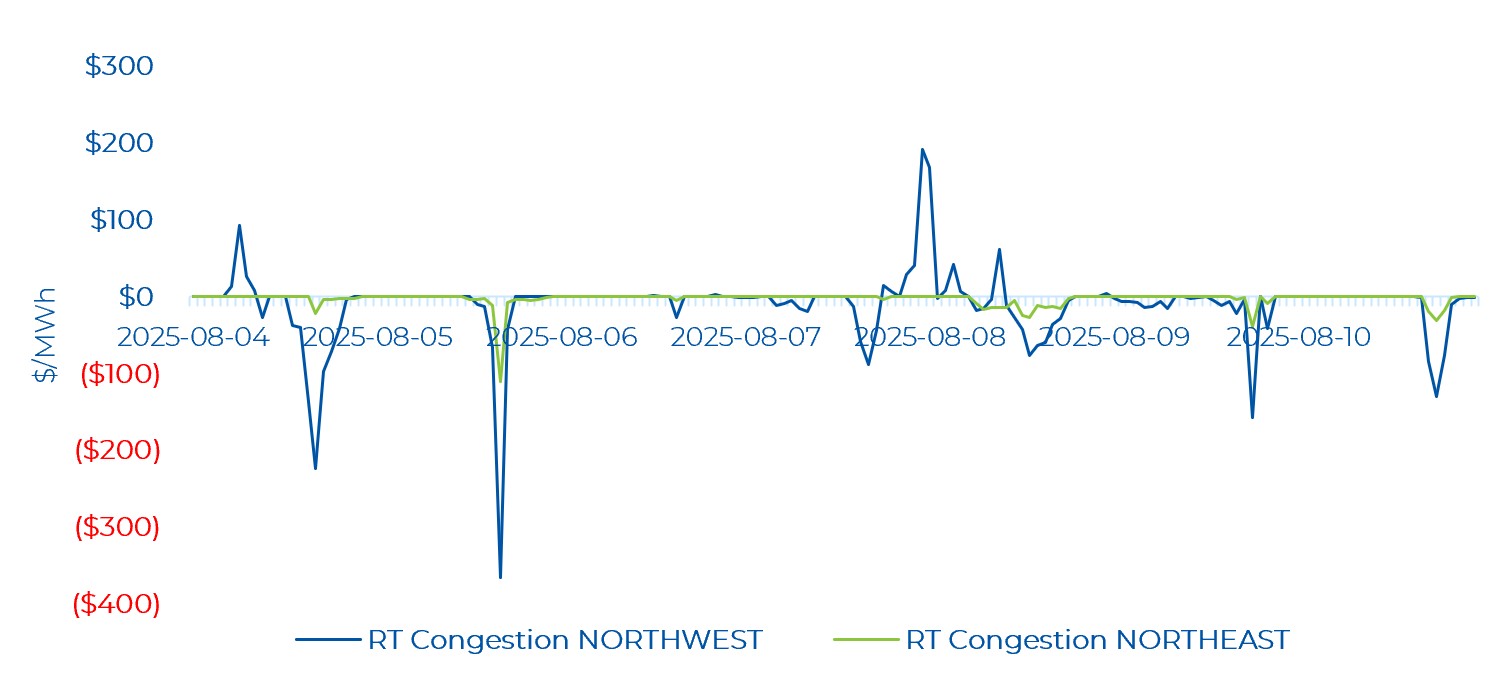
Notably, the Ottawa zone experienced positive real-time congestion – the first time this has occurred in the renewed market. The positive congestion occurred on August 9 HE 14 and hit $154.93/MWh. The congestion was likely a result of exports to Quebec, which was importing 1,152MW. Power Advisory expects similar congestion to occur in the winter when Quebec imports a significant amount of energy. The West zone saw very negative congestion for several hours last week, with congestion hitting a low of -$457.20/MWh (similar to the Northeast and Northwest zones occurring on August 5 HE 17). There was also congestion in the Southwest zone (a low of -$47.26/MWh) and the Niagara zone (a low of -$75.61/MWh) on August 9.