Given it has been a full year since the launch of MRP, Power Advisory will be hosting a webinar reviewing the price related outcomes in the renewed market over the first year. We will be sending out an invite in the coming days and expect to host the webinar on Wednesday, June 10th, 2026.
Day-Ahead and Real-Time Price Trends by Components and by Zone
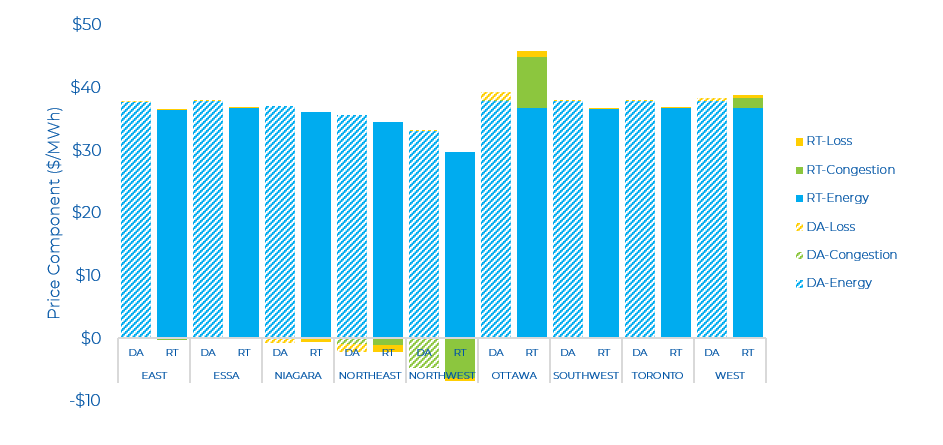
Ontario’s wholesale market continued to take a breather last month, with relatively low prices across all zones. The average Day-Ahead (DA) dropped to $37/MWh compared to $46/MWh in March. DA zonal prices ranged from $28/MWh (Northwest) to $39/MWh (Ottawa), while Real-Time (RT) zonal prices ranged between $23/MWh (Northwest) to $46/MWh (Ottawa). These monthly average DA prices mark the lowest level since the first month of the launch of the renewed market. Although total energy demand (and peak) dropped in April compared to March, total hydro output has increased. Overall, the combination of milder weather and higher hydro output puts downward pressure on prices (in both the renewed and legacy market).
The DA and RT price by zone and by component for the past month is shown below. Prices in the Northwest zone and Ottawa zone were impacted the most due to congestion.
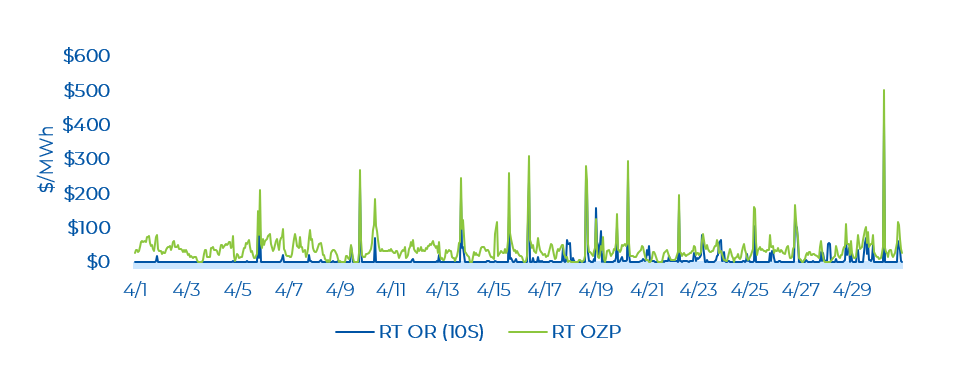
Day-Ahead and Real-Time Prices
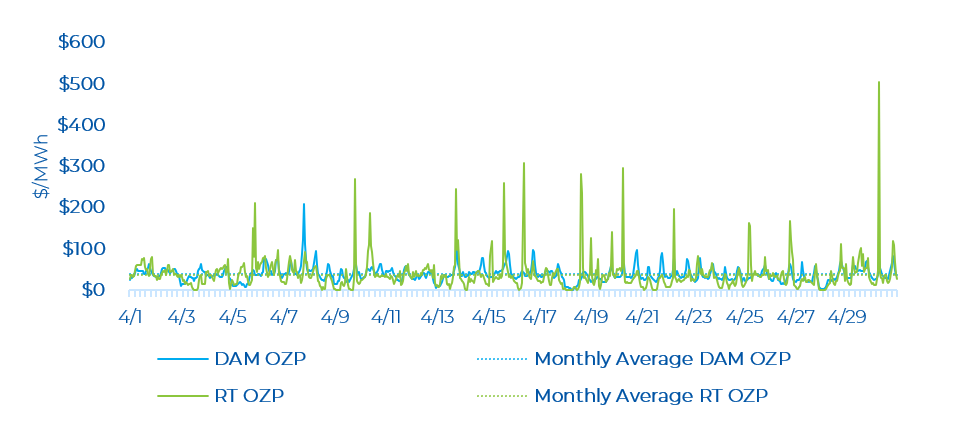
Similar to March, April continues to show relatively lower prices. There were only 9 real-time hourly OZP spikes greater than $200/MWh. The average hourly day-ahead OZP was $37.72/MWh in April, while the real-time OZP was $37.26/MWh. The highest real-time OZP was $503.30/MWh (on April 30, HE 7). The peak Ontario demand in April was 18,461 MW (on April 7, HE 20). The April Ontario peak demand was 1,934 MW lower than the peak in March – as more moderate temperatures continue. The Ontario demand on April 30, HE 7 – when OZP hit its highest level – was 16,607 MW, which is well below the peak demand of more than 24,000 MW in the summer of 2025.
OR Prices
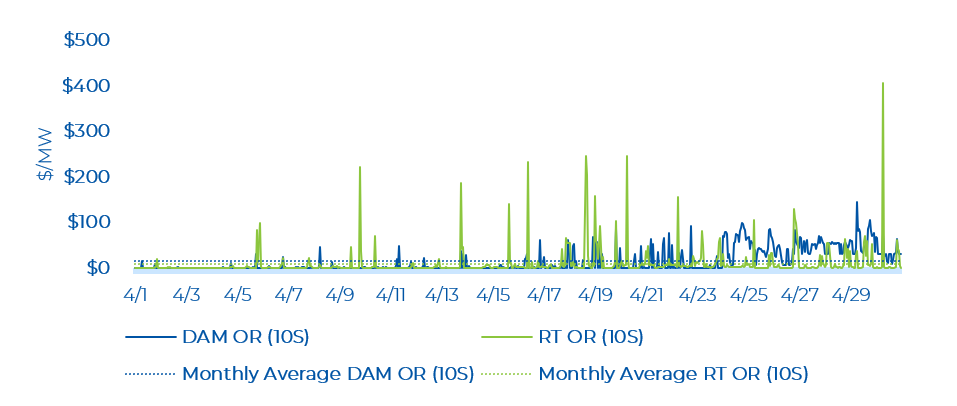
There were slightly more real-time Operating Reserve (OR) price spikes in April compared to March. Although April did not break the record for the lowest day-ahead OR price since the launch of the renewed market. Similar to March, April observed both low day-ahead and real-time average monthly OR prices. The average monthly day-ahead 10S price was $3.39/MW, while it was $10.35/MW in real-time. The DA OR price was more in line with historical averages in the legacy market. The highest real-time OR price spike was $405.24/MW and occurred at the same hour as the highest real-time OZP spike. In the day-ahead market, the most common 10S price was $0/MWh (occurred 54% of the time) while in the real-time market, it was $0.10/MW (occurred 13% of the time).
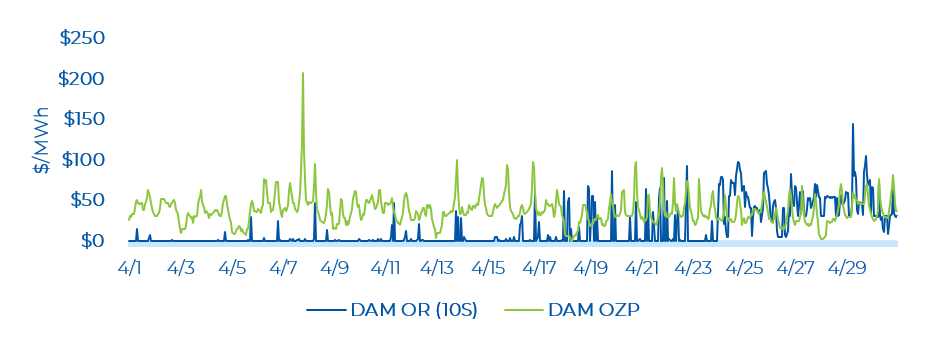
The highest day-ahead OR price was $144.01/MW, which occurred on April 29, HE 7. The day-ahead energy price was $59.98/MW at this time. The day-ahead OR price exceeded the day-ahead energy price in 138 hours or 19% of total hours in April. This trend is significantly higher than the amount in March, where 10 hours (1% of total hours) experienced the OR price exceeding the energy price – meaning that in these hours the OR market was tight and reserve prices can put upward pressure on energy prices due to co-optimization. As can be observed in the figure below, OR prices tended to exceed energy prices more frequently in the end of April.
Real-time OR prices were low (i.e., near $0.10/MW) for many hours. There were several hours with real-time OR price spikes, coincident with real time OZP spikes. The highest real-time OR price was $405.24/MW on April 30, HE 7. The real-time OR prices exceeded the real-time energy prices across 50 hours or 7% of total hours in April. This is higher compared to March and February when there were 9 hours (1% of total hours) and 26 hours (4% of total hours) respectively when OR prices exceeded the energy prices.
Zonal Prices and Congestion
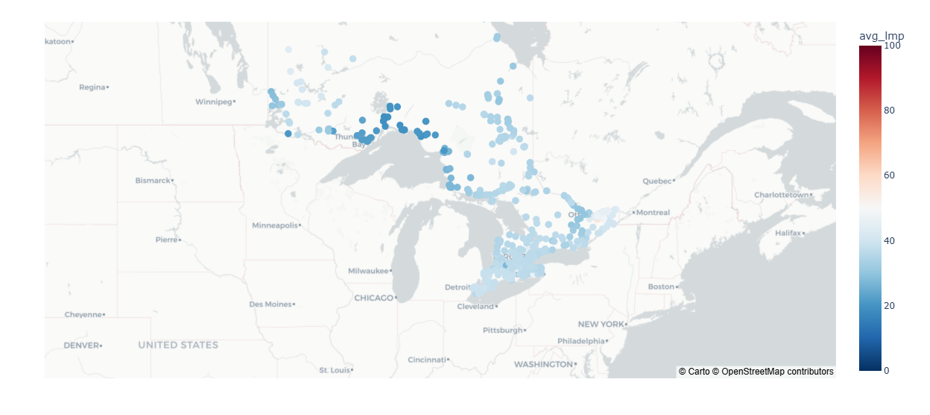
The average real-time nodal price (LMP) across Ontario for April is shown in the figure below. In April, the nodes in the northern zone tended to be slightly lower than all other zones. This is likely due to the transmission constraints moving power between Northern Ontario to Southern Ontario as well as moderate weather (and demand) across all of Ontario.
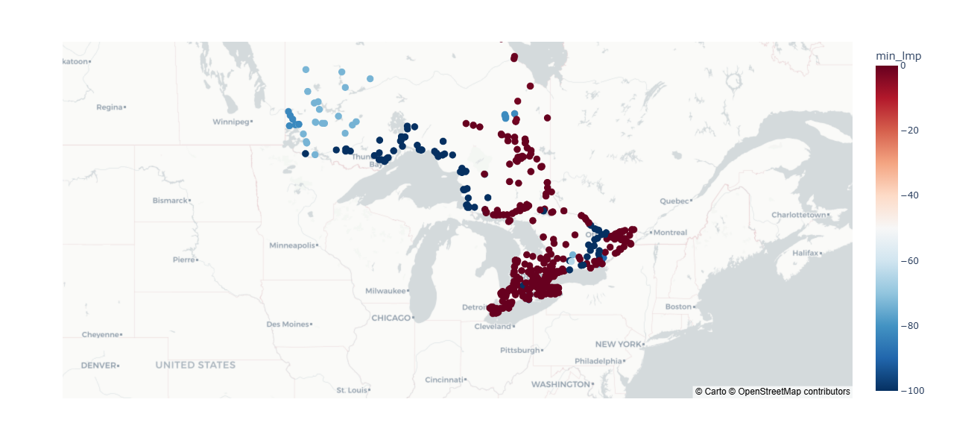
An interesting observation from this April is the frequent occurrence of very negative LMPs in the northern zones. Electricity prices of nodes in the northern zones and few in the east zone went as low as -$100/MWh while all other zones experienced a low of $0/MWh. Since the launch of the renewed market, there were some prices close to or few at -$100/MWh, but April had shown the most frequent occurrence of -$100/MWh prices for northern nodes across several hours. To note, the renewed market had a change in the settlement floor price of -$100/MWh that may be influencing the nodal prices.
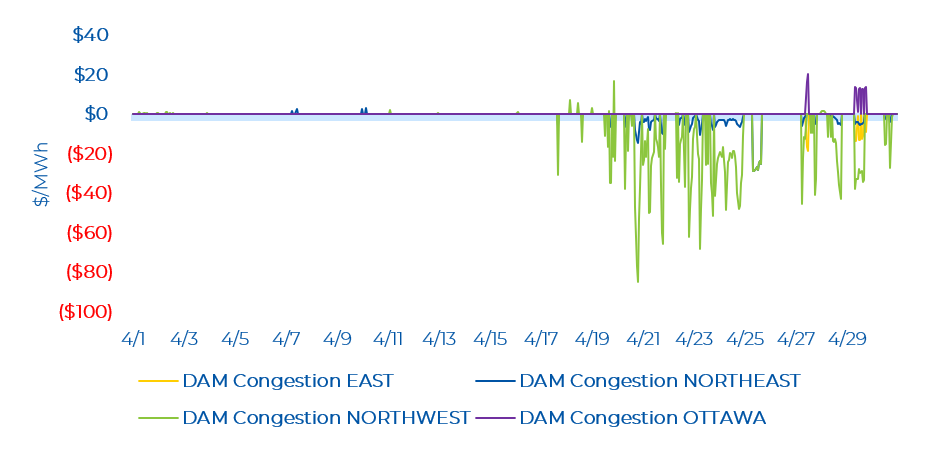
In April, there was minimal congestion across few zones. The Northwest zone saw the most hours of congestion with a low of - $85.04/MWh. The Northwest zone saw mainly negative congestion with a low of - $28.56/MWh. Congestion in the East and Ottawa zones occurred mostly at the same hours at the end of the month. The East and Ottawa zone saw a low - $18.53/MWh and high of $20.52 respectively. Note that negative congestion typically means there was a constraint exporting energy from a particular zone (and lower energy prices), while positive congestion is the opposite.
In real-time, the Northeast and Northwest zone saw several hours of consecutive negative congestion, especially concentrated in the end of April. The Northwest zone saw a high of $375.81/MWh (on April 12, HE 16) and a low of - $240.11/MWh (on April 30, HE 7). The Northeast zone saw a high of $55.52/MWh (on April 7, HE 16) and a low of - $36.10/MWh (on April 25, HE 11).
In the first-half of April, there were several outages on the East-West Transfer East (EWTE)/East-West Transfer West (EWTW) interfaces, which can limit flows between the Northwest and the rest of the province and cause congestion. There continues to be reduced capacity maintained on Flow-South (FS) (FS is operating at minimum capacity) for April, since December. Again, this can limit the flow of energy from the northern zones to the major load centres in the south. Compared to March, in April there were fewer northern interfaces with reduced capacity. These northern interfaces with outages were the following: Transfer East of Mackenzie, St. Lawrence West, Ontario-Michigan Import and Export. There was minimal reduced capacity on the Flow Into Ottawa (FIO) (mainly concentrated in mid-April) but increased occurrences of reduced capacity on the Ontario-Quebec Beauharnois Import interfaces (ON-QC Beauharnois) (in the first half of April) compared to what was observed in March.

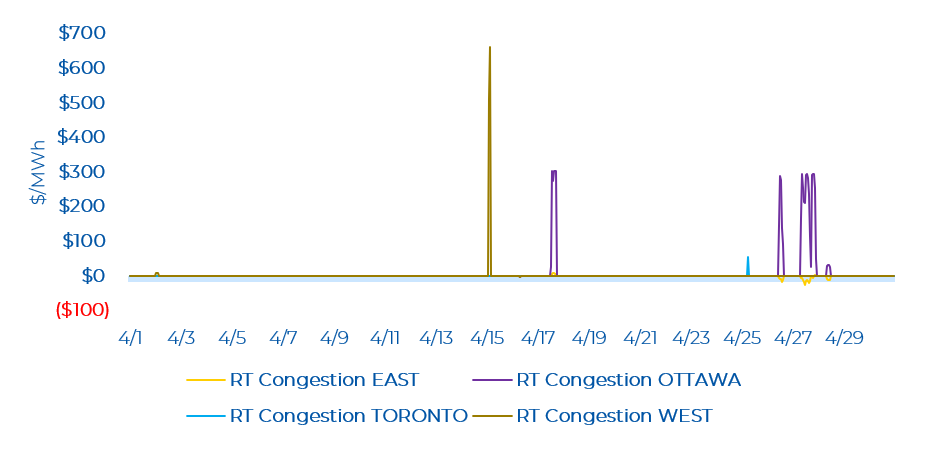
Other than the Northern zones, in real time, there were minimal hours of congestion. The West zone observed two spikes of $510.78/MWh and $661.67/MWh (on April 15, HE 3 and HE 4). The Ottawa zone observed several spikes close to $300/MWh. While congestion in the Toronto and East zone was relatively smaller with a high of $55.15/MWh and low of -$26.09/MWh. Congestion zone in the Ottawa zone made an appearance last month (as it didn’t in the month of March).
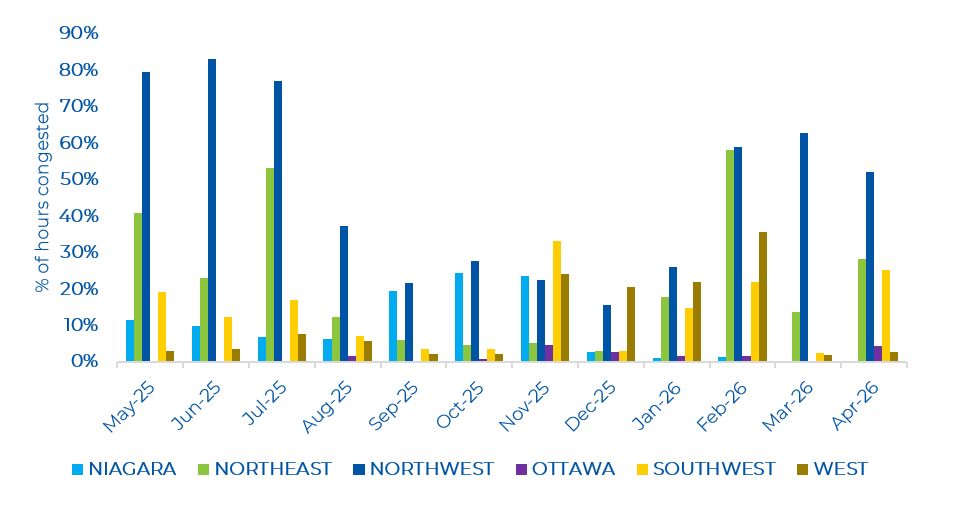
In April, the number of congested hours in the Northern zones remained relatively high. Increased hours of minor congestion in the Southwest zone as well as congestion in the Ottawa zone has returned in April. Note that the congestion observed in the Ottawa zone at the end of the month is unrelated to outages or reduced capacity on major Ottawa-connected interfaces as these occurred earlier in the month.
As shown in the figure below, April saw some northern major interfaces with reduced capacity, specifically the EWTE/EWTW and FS. The FIO and ON-QC Beauharnois interfaces had more frequent occurrences of reduced capacity in April compared to March.
