Note: We have transitioned to providing monthly reviews of the renewed IESO-Administered Market (IAM). For clients interested in weekly or daily reviews, please do reach out to Power Advisory.
Day-Ahead and Real-Time Price Trends by Components and by Zone
The average Day-Ahead (DA) zonal prices ranged from $82/MWh (West) to $112/MWh (Ottawa) in December, while Real-Time (RT) zonal prices ranged between $63/MWh (West) to $117/MWh (Ottawa). There were a few notable changes in pricing across the IAM in December. Similar to November, the Ottawa zone was the highest priced zone in both the DA and RT markets. The primary driver of high prices in the Ottawa zone was the combination of reduced capacity on a major transmission line and a significant increase in demand for exports to Quebec as the Quebec grid was facing near load shedding conditions. Second, there was considerable negative congestion across the West zone.
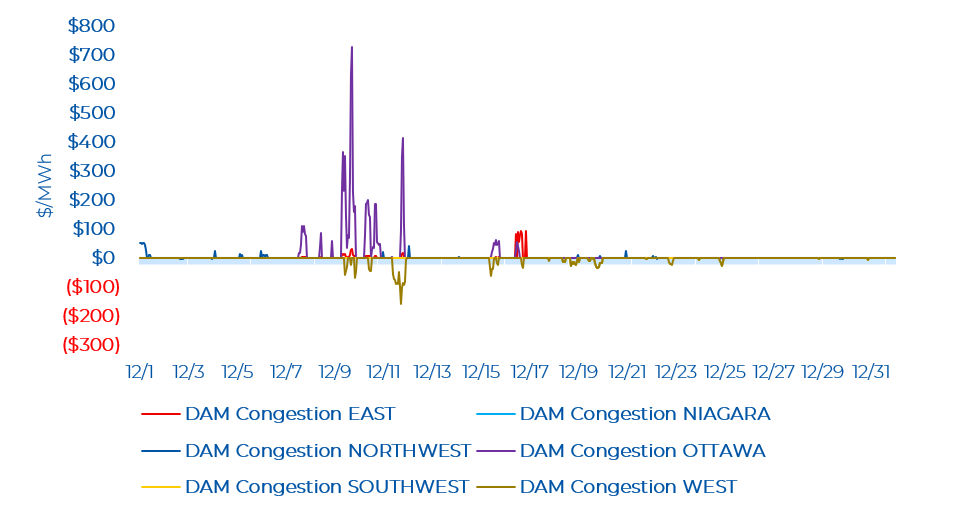
The DA and RT price by zone and by component for the past month is shown below. Prices in both the Ottawa and West zones were clearly an outlier compared to other zones.

Day-Ahead and Real-Time Prices
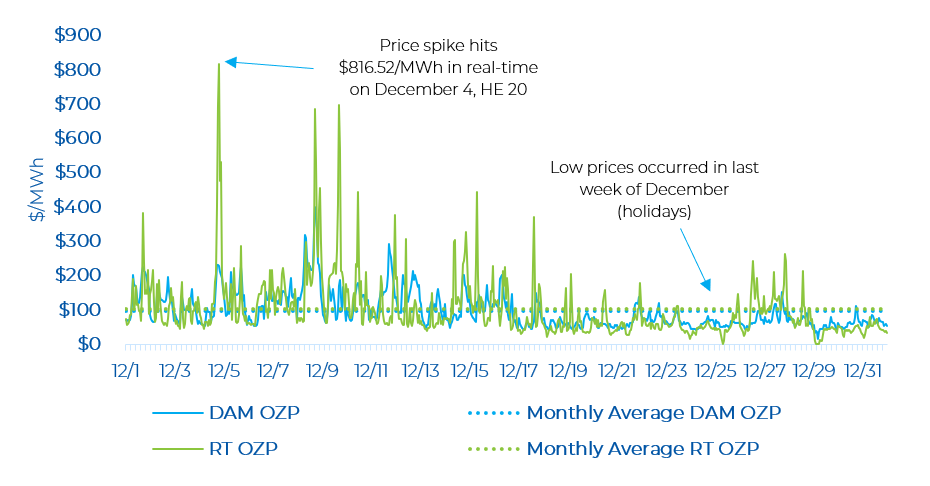
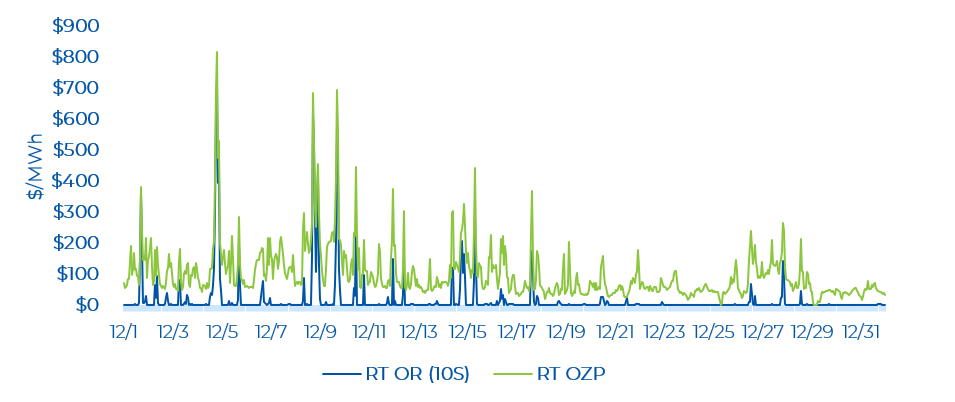
The average hourly day-ahead OZP was $96.90/MWh in December, while the real-time OZP was $101.10/MWh. There were 69 real-time hourly OZP spikes greater than $200/MWh in December. Most of these price spikes occurred in morning or evening hours. The highest real-time OZP was $816.52/MWh (on December 4, HE 20) when the Quebec grid was facing an extremely tight supply/demand balance (Hydro Quebec issued internal alerts to meet the surge in demand). The real-time OZP remained elevated for several hours on December 4 (i.e. above $200/MWh) as a result of a tight supply/demand balance in Ontario and high exports to Quebec. The peak Ontario demand in December was 21,406 MW (on December 4, HE 18). In November, the peak Ontario demand was about 1,600 MW below that amount. While in December 2024, the peak Ontario demand was about 20,900 MW. The Ontario demand on December 4, HE 20 – when OZP hit its highest level – was 21,178 MW. Noticeably, there were lower prices in the last week of December compared to the rest of the month as Ontario demand declined due to more moderate temperatures and the holidays.
OR Prices
There were several real-time Operating Reserve (OR) price spikes in the first-half of December. The low OR prices at the end of December are also likely connected to the low demand observed during these days (due to the weather and the holidays). The average monthly day-ahead 10S price was $21.74/MWh, while it was $16.86/MWh in real-time. OR prices continue to be well above prices in the legacy market. In December, average real-time OR prices were lower than November and day-ahead OR prices were higher than November (both by a few dollars difference). The highest OR price spike of $696.54/MWh occurred at the same hour as the highest real-time OZP spike was observed. In the day-ahead market, the most common 10S price was $5/MWh while in the real-time market, it was $0.10/MWh.
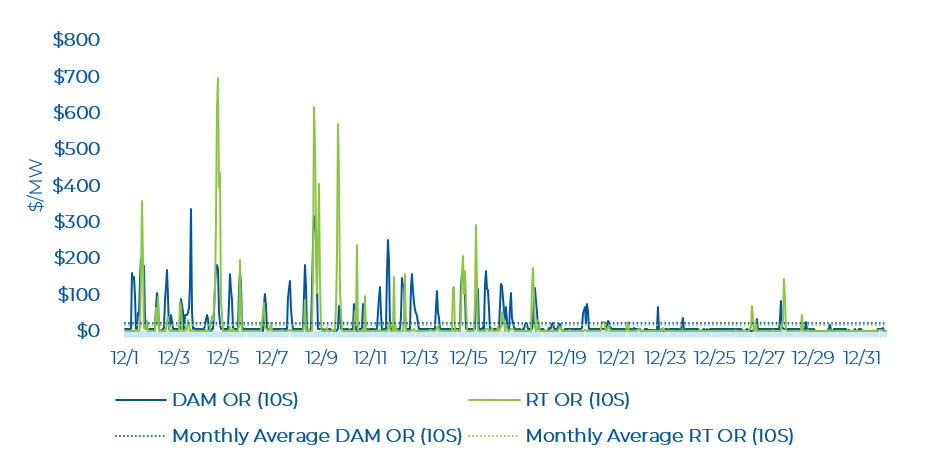
The highest day-ahead OR price was $334.91/MWh, which occurred on December 3, HE 18. The day-ahead energy price was $160.26/MWh at this time. In one hour, the OR price exceeded the energy price. This is lower compared to November, where in 29 hours, the OR prices exceeded the energy prices (i.e. tight reserve market was pulling up energy prices).
Real-time OR prices were low (i.e., near $0.10/MWh) for many hours. There were a few hours with real-time OR price spikes, coincident with real time OZP spikes. The highest real-time OR price was $696.54/MWh on December 4, HE 20. In only three hours, the OR prices exceeded the energy prices. This is far lower compared to November, where in 51 hours, the OR prices exceeded the energy prices.
Zonal Prices and Congestion
In December, the most congested zones were Ottawa, East, and West in the day-ahead time frame. The Ottawa and East zones typically experienced congestion in the same hours, with the magnitude being highest in Ottawa (high of $729.95/MWh vs high of $93.38/MWh in the East zone). The West zone saw frequent hours of consecutive negative congestion, with a low of -$157.71/MWh. The Niagara and Southwest zone saw a more limited number of hours with negative congestion. The negative congestion in the Niagara and Southwest zones was nearly identical in magnitude and occurring at the same hour (the West zone also saw the same congestion at these hours with the exception of a couple of hours). The Northwest zone saw some hours of positive and minor negative congestion with most congested hours concentrated on the first day of December. Note that negative congestion typically means there was a constraint exporting energy from a particular zone, while positive congestion is the opposite.
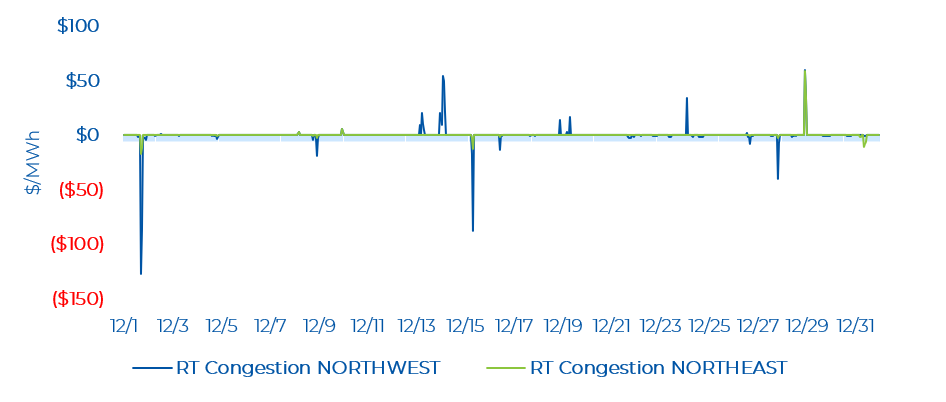
Real-time congestion in the Northwest and the Northeast zones has subsided to a large degree – particularly from what was experienced in the summer months. The Northwest still saw more hours of congestion than the Northeast zone. The highest congestion in the Northwest was $59.49/MWh (on December 28, HE 23) with a low of -$127.56/MWh (on December 1, HE 18). The Northeast zone saw congestion hit a high of $59.43/MWh (also on December 28, HE 23 like the Northwest zone) and a low of - $16.69/MWh (also on December 1, HE 18 like the Northwest zone).
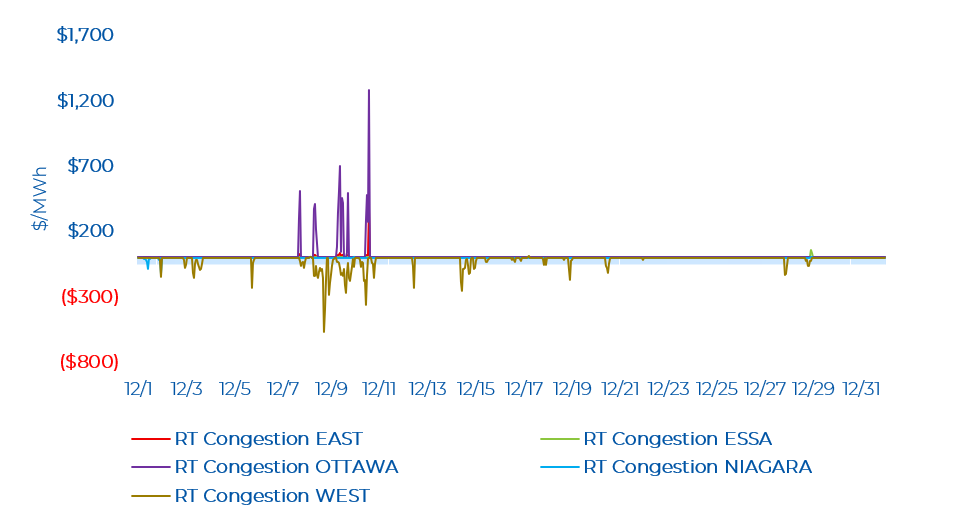
Similar to day-ahead, in real time, the Ottawa and East zones observed congestion at the same hours in the first half of December. The Ottawa zone saw a high of $1,281.62/MWh and the East zone saw a high of $366.49/MWh (on December 10, HE 15). At this hour in particular, exports to Quebec were close to the maximum quantity observed this month. In all hours of congestion for these zones, the Flow Into Ottawa (FIO) interface - important in supplying demand in the Ottawa Zone and facilitating exports to Quebec, had a 100 MW or 200 MW outage (i.e. operating at a minimum of 93% of its All-In-Service limit).
The West zone saw frequent consecutive hours of negative congestion, concentrated across different days. This was likely pronounced because of several outages observed on major transmission interfaces. In December, there were frequent outages on the East-West Transfer East (EWTE)/East-West Transfer West (EWTW), Flow South (FS), and the Mississagi Flow West (MISSW)/Mississagi Flow East (MISSE) interfaces. The Niagara zone had a low number of mainly negative congestion hours. The Niagara zone saw a low of - $125.11/MWh (on December 1, HE 23). At this hour, the West zone saw a similar magnitude of congestion.
From a transmission lens, the likely trigger for congestion at this hour (December 1, HE 23) in particular was a bottleneck of supply in these zones, triggered by a reduction in Ontario demand and reduced capacity of closely connected major transmission interfaces to support flow elsewhere. There was a 500 MW outage on the Flow East Towards Toronto (FETT) interface and the Queenston Flow East (QFW) interface, and a reduction of demand by more than 1,100 MW from the previous hour. As highlighted by the IESO, the FETT transfer capability is important for delivering supply from the West, Southwest, Bruce and Niagara to reliably supply demand in Toronto, Essa, East, Ottawa, Northeast and Northwest zones. The QFW transfer capability is important for delivering supply from the Niagara Zone and imports from New York at Niagara to the rest of the province. The Essa zone saw only two hours of positive congestion (on December 28 HE 23 and HE 24). As expected, the Northwest and Northeast zones saw a similar magnitude in positive congestion at these hours. There was reduced capacity on the EWTW/ETWE and FS interfaces which connects supply across these zones.
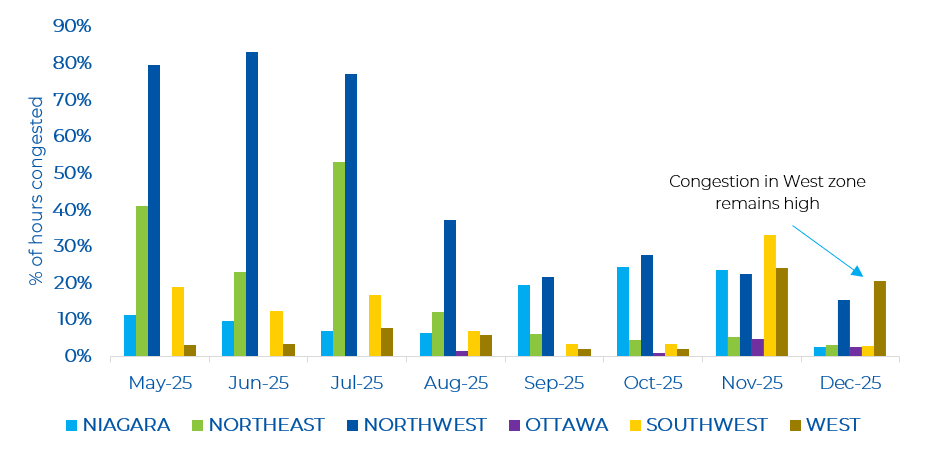
In December, both the Niagara and Southwest zone saw a drop in the number of congested hours compared to November. However, the Ottawa and West zones saw a similar number of congested hours in November and December. Congestion in the Northern zones have significantly reduced since the summer months.
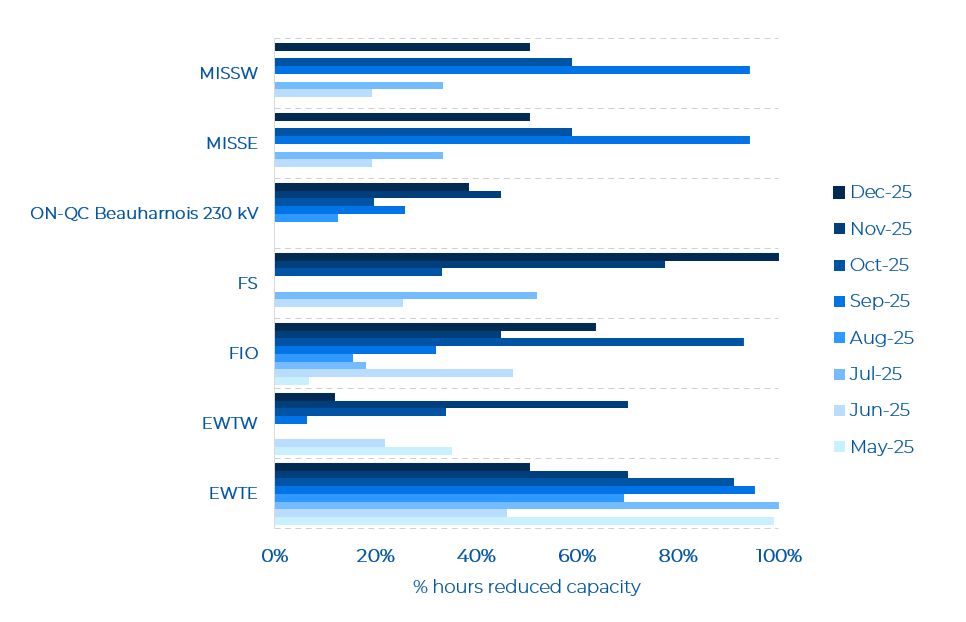
As shown in the figure below, December saw many northern major interfaces with reduced capacity, even though overall congestion across all zones has declined since November. The EWTE/EWTW continued to show reduced capacity in December. In contrast to November, there were significantly more hours with reduced capacity on the MISSE/MISSW. Interestingly, FS connecting Northeast and Essa, experienced the most hours of reduced capacity since the launch of the renewed market.
As noted previously, for the Ottawa zone, congestion was likely influenced by the combination of extreme demand conditions in Quebec that resulted in maximum exports from Ontario and reduced capacity on the FIO interface (in addition to high exports into Quebec at some hours).