Day-Ahead and Real-Time Prices
Volatility in prices observed in the end of January continued into the beginning of February with 119 real-time hourly OZP spikes greater than $200/MWh in February. The average hourly day-ahead OZP was $117.49/MWh in February, while the real-time OZP was $115.98/MWh. The highest real-time OZP was $978.33/MWh (on February 10, HE 21). The peak Ontario demand in February hit 21,601 MW (on February 9, HE 19). The February Ontario peak demand was 441 MW higher than the peak in January. The Ontario demand on February 10, HE 21 – when OZP hit its highest level – was 19,916 MW, which is well below the peak demand of more than 24,000 MW in the summer of 2025.

Day-Ahead and Real-Time Price Trends by Components and by Zone
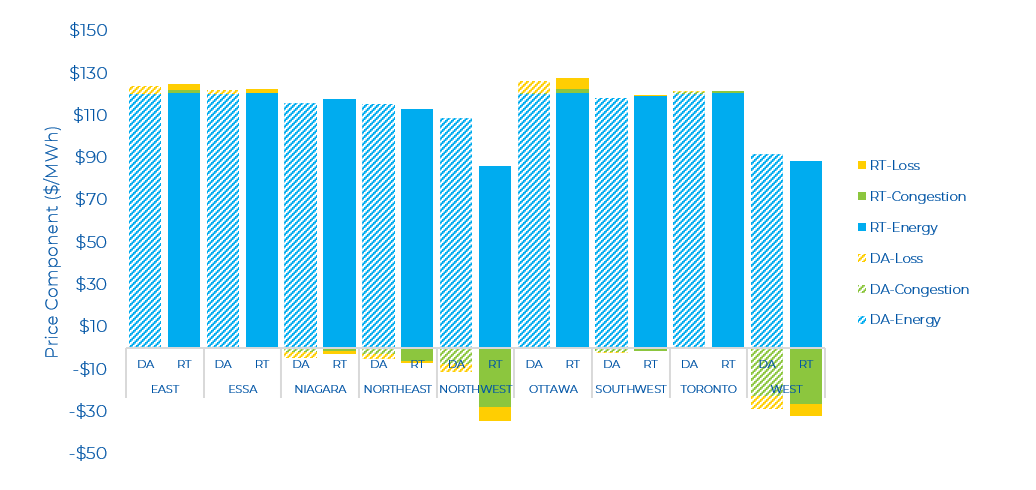
In February, the average Day-Ahead (DA) zonal prices ranged from $63/MWh (West) to $126/MWh (Ottawa), while Real-Time (RT) zonal prices ranged between $51/MWh (Northwest) to $128/MWh (Ottawa). [BC1.1]Similar to January, the Ottawa zone was the highest priced zone in both the DA and RT markets. The primary driver of high prices in the Ottawa zone was the combination of reduced capacity on a major transmission line and general increased demand in the winter months for exports to Quebec. The Northwest and West zones experienced many hours of extreme negative congestion. There were several outages across many northern-transmission interfaces which can create a “bottleneck” of supply in some zones.
The DA and RT price by zone and by component for the past month is shown below. Prices in both the Northwest and West zones were clear outliers compared to other zones.
OR Prices
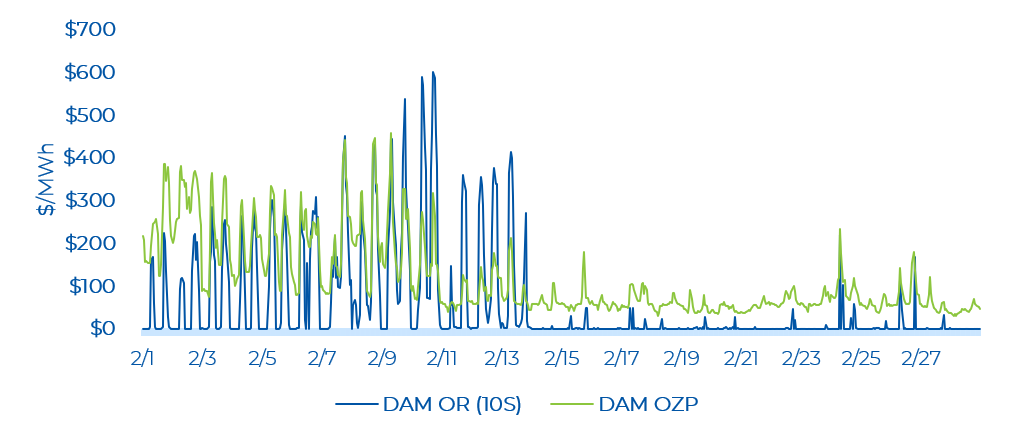
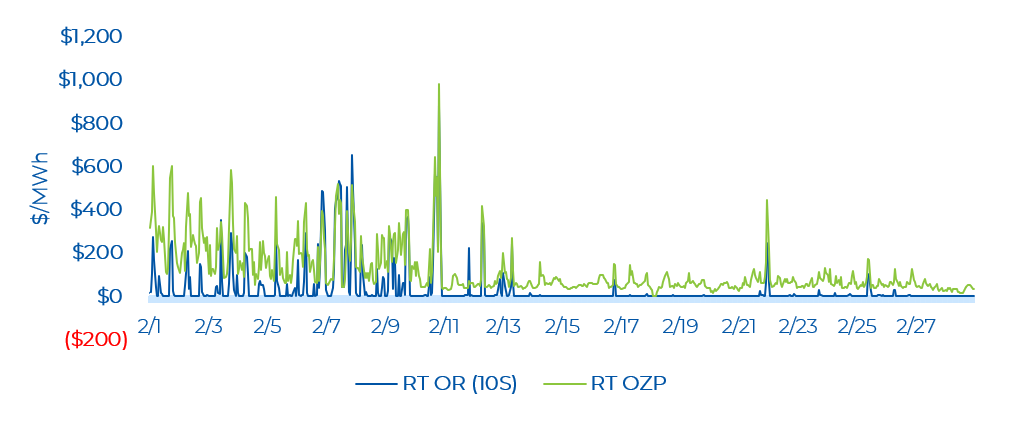
There were several real-time Operating Reserve (OR) price spikes in the beginning of February. The high OR prices in the beginning of February occurred at the same time as the high OZPs during these days. The average monthly day-ahead 10S price was $55.91/MWh, while it was $33.36/MWh in real-time. As noted in previous commentary, these OR prices are well above average prices in the legacy market In February, the average day-ahead and real-time OR prices were higher than January (while the OZP averages were lower than January). As such, it is likely that the OR market was tight and therefore the OR prices helped to pull up OZP prices in February. The highest real-time OR price spike of $878.54/MWh occurred at the same hour as the highest real-time OZP spike. In the day-ahead market, the most common 10S price was $0/MWh while in the real-time market, it was $0.10/MWh.

The highest day-ahead OR price was $600/MWh, which occurred on February 10, HE 18. The day-ahead energy price was $317.17/MWh at this time. It should be noted that $600/MW OR price is part of the new Operating Reserve Demand Curve (ORDC) mechanism that was implemented as part of MRP. The day-ahead OR price [BC2.1]exceeded the day-ahead energy price in 53 hours in February. This trend is higher and close to double the amount in January, where 27 hours experienced the OR price exceeding the energy price (i.e. this also shows that a tight reserve market was pulling up energy prices).
Real-time OR prices were low (i.e., near $0.10/MWh) for many hours. There were a several hours with real-time OR price spikes, coincident with real time OZP spikes. The highest real-time OR price was $878.54/MWh on February 10, HE 21. The real-time OR prices exceeded the real-time energy prices[BC3.1] across 26 hours in February. This is higher compared to January when there were 12 hours when OR prices exceeded the energy prices.
Zonal Prices and Congestion
In February, the most congested zones were the Northeast, Northwest, Niagara, Southwest, and West in the day-ahead time frame. The Northeast and Northwest zones saw congestion at almost the same hours. Both zones observed mainly negative congestion, but in terms of extremes, the Northeast saw a high of $664.18/MWh while the Northwest saw a low of -$267.86/MWh. The Niagara zone saw a few hours of negative congestion concentrated in the first half of February. Similarly, within the first half of February, the Southwest zone saw more hours of negative congestion compared to the Niagara zone, while the West zone saw even more hours of negative congestion compared to the Niagara zone. These zones saw a low of close to -$270/MWh. The Toronto and Ottawa zones experienced minor positive congestion, while the Toronto zone saw several consecutive hours of minor positive congestion in the first eight days of February. Note that negative congestion typically means there was a constraint exporting energy from a particular zone, while positive congestion is the opposite.
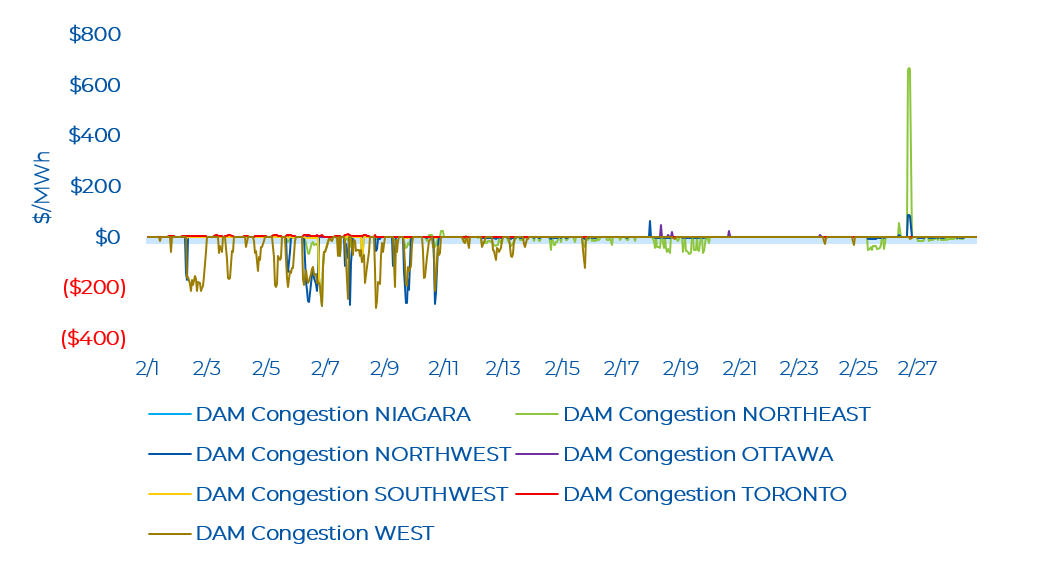
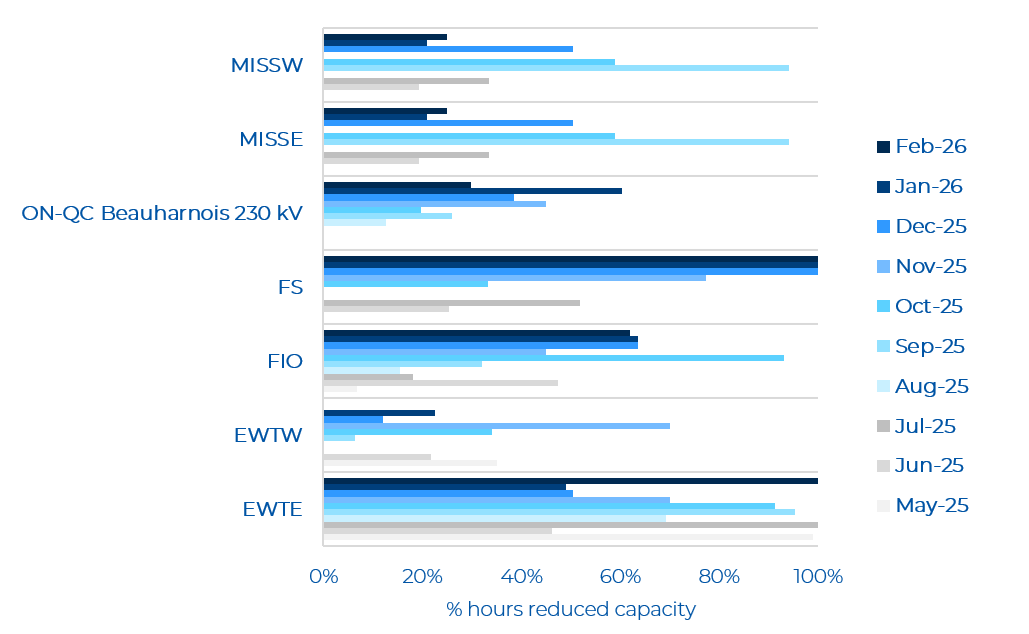
The overall volatility in energy prices in the beginning of February can be seen in the increased real-time congestion observed mainly in the Northwest zone. The Northwest zone saw a low of -$694.81/MWh (on February 10, HE 21 – the same hour as the highest RT OZP) with a high of $267.17/MWh (on February 28, HE 10). The Northeast zone also saw several hours of mainly negative congestion with some positive congestion. The Northeast zone saw a high of $124.31/MWh (February 10, HE 19) and a low of - $100.41/MWh (on February 12, HE 8 – at the same hour as the highest RT OZP observed for that day). Similar to January, there continues to be outages on major northern interfaces: East-West Transfer East (EWTE)/East-West Transfer West (EWTW), Flow South (FS), and the Mississagi Flow West (MISSW)/Mississagi Flow East (MISSE). At the end of February, there was also some reduced capacity on the Virtual Trading Northeast Zonal Limit and outages on other interfaces: Flow East to Toronto (FETT) and Ontario-Minnesota Transfer North (MPFN). Other non-northern interfaces with outages or reduced capacity can also influence congestion observed across nearby zones. Into the first week of February from the last days of January, there continued to be a 12% reduction in capacity[BC4.1] on the Flow Into Ottawa (FIO) interface and a full outage on the Ontario-Quebec Beauharnois Import (ON-QC Beauharnois) interface (since the very end of January), likely adding to the overall congestion and volatility in energy prices observed in the first week of February. Note, that the FIO experienced several more hours of reduced capacity in the rest of February while the ON-QC Beauharnois experienced one other day of full outages.
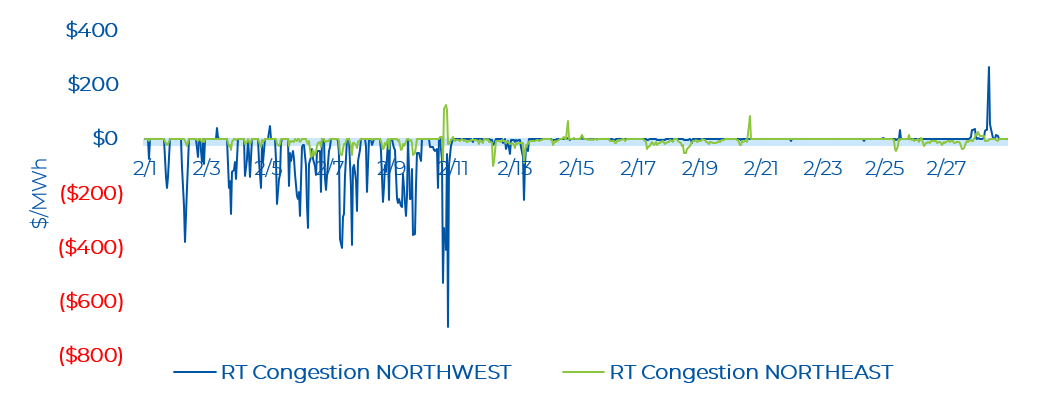
Other than the Northern zones, in real time, the Niagara and the Southwest zones saw congestion of the same magnitude in several of the same hours, mainly concentrated in the first week of February. The Niagara and Southwest zone experienced a low of -$215.67/MWh and -$218.26/MWh respectively. The West zone experienced several hours of consecutive negative congestion, with many hours of congestion below - $200/MWh and a low of -$481.93/MWh (on February 7, HE 10). Outages on major northern interfaces, also likely influenced the volatility in congestion across these zones as well.
The Ottawa and East zones mainly observed congestion at the same hours. The Ottawa zone saw a high of $428.48/MWh (on February 22, HE 9) and the East zone saw a high of $330.91/MWh (on February 26, HE 22). Congestion in these zones is often connected to zonal exports to nearby jurisdictions. On February 22, when Ottawa saw its peak congestion, there was a 12% reduction in capacity on the FIO interface. On February 26, when the East zone saw its peak congestion there was a 55% reduction in capacity on the FIO interface, and an increase of exports of 380 MW from the previous hour to New York – likely putting pressure on the East zone to import more energy from other Ontario zones to deliver exports elsewhere.
Similar to the day-ahead time frame, the Toronto zone experienced some hours of consecutive positive congestion in the first week of February, and one hour of relatively higher positive congestion of $51.02 at the end of the month (on February 23, HE 12).

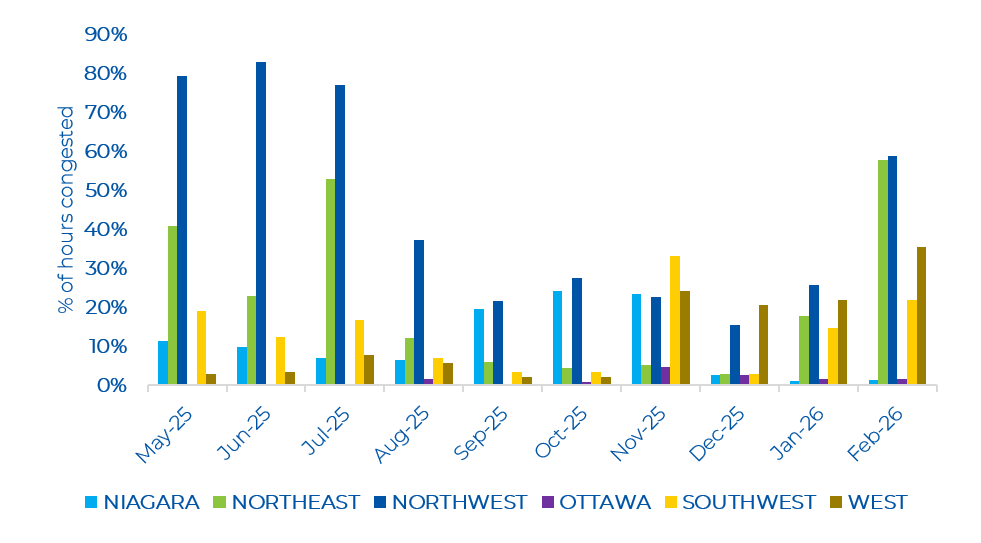
In February, the Northwest, Northeast, Southwest, and West zones saw an increase in the number of congested hours compared to January. In particular, there was a significant rise in the number of congested hours for the Northern zones, which was much greater than the number of congested hours experienced since August of last year. The Northeast and West zones have seen the most congested hours this month since the launch of the renewed market.
As shown in the figure below, similar to January, February saw many northern major interfaces with reduced capacity. The EWTE, MISSE/MISSW, FS, and FIO continued to show reduced capacity in February. The EWTE observed all hours with reduced capacity this month. Compared to January, the number of hours with reduced capacity on the ON-QC Beauharnois interface reduced by half. In consecutive hours in the first week of February, this interface experienced a full outage which was likely connected to Quebec’s extreme weather conditions and the impact to its electricity system.