Note: We have transitioned to providing monthly reviews of the renewed IESO-Administered Market (IAM). For clients interested in weekly or daily reviews, please do reach out to Power Advisory.
Day-Ahead and Real-Time Prices
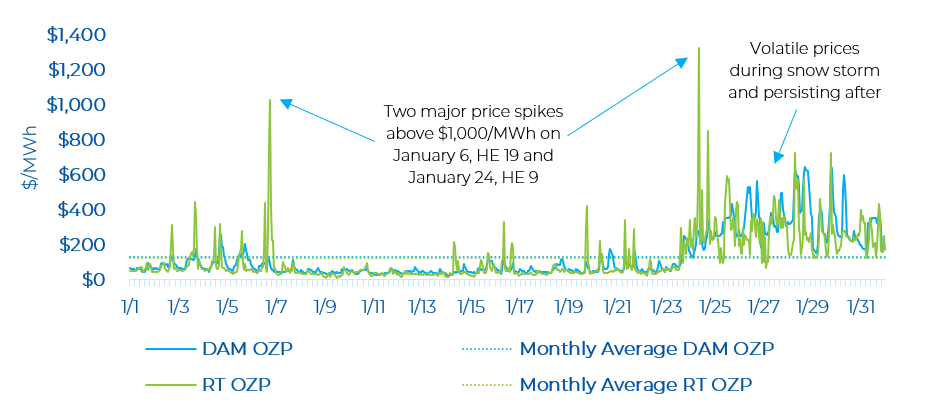
The IESO-Administered Market (IAM) experienced a record-setting month in January in terms of the average wholesale price. The average hourly day-ahead OZP was $132.42/MWh in January, while the real-time OZP was $122.01/MWh. These are the highest average monthly price in the IAM since it was first launched in 2002.
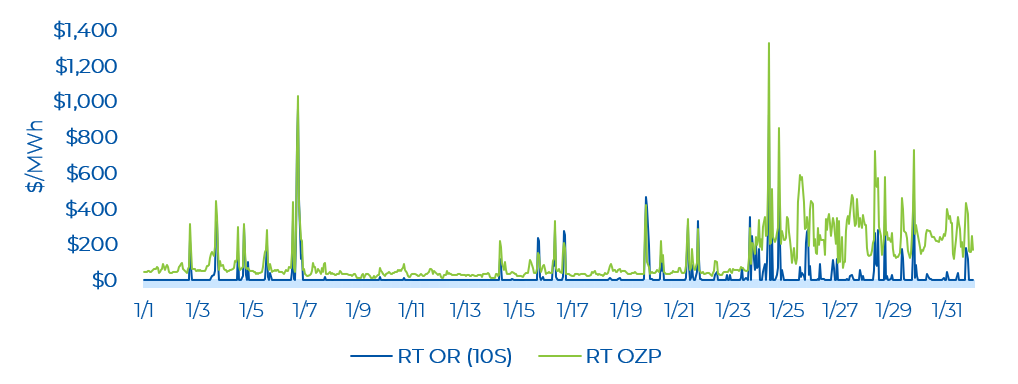
There were 167 real-time hourly OZP spikes greater than $200/MWh in January. The highest real-time OZP was $1,327.42/MWh (on January 24, HE 9) when neighbouring markets such as Quebec, New York and New England were in an extremely tight supply/demand balance. The second highest real-time OZP was $1,031.08/MWh (on January 6, HE 19). The peak Ontario demand in January was 22,042 MW (on January 23, HE 19). The January Ontario peak demand was 640 MW higher than the peak in December. The Ontario demand on January 24, HE 9 – when OZP hit its highest level – was 20,043 MW, which is well below the peak demand of more than 24,000 MW in the summer of 2025.
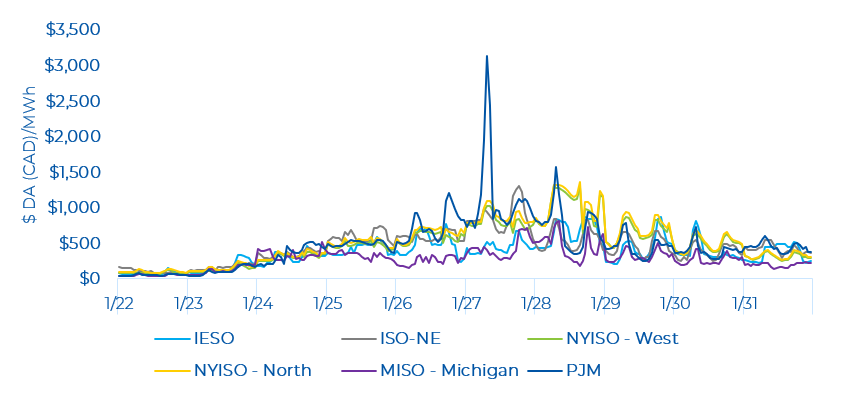
It should be noted that the entire eastern portion of North America was facing extreme weather conditions, with all wholesale markets facing extreme conditions. Wholesale prices in Ontario were lower than many other jurisdictions and Ontario was exporting significant amounts throughout the last two weeks.
Day-Ahead and Real-Time Price Trends by Components and by Zone
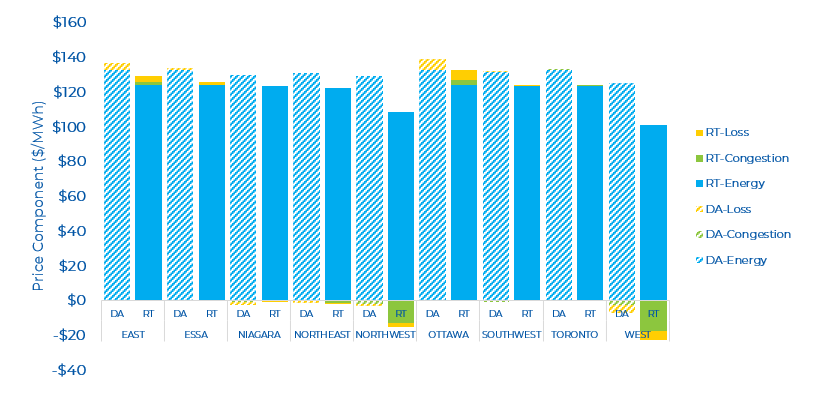
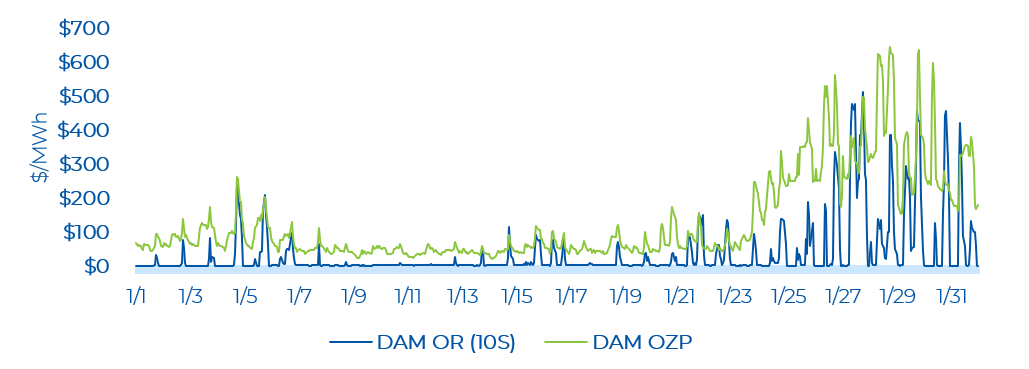
The average Day-Ahead (DA) zonal prices ranged from $118/MWh (West) to $139/MWh (Ottawa), while Real-Time (RT) zonal prices ranged between $79/MWh (West) to $133/MWh (Ottawa). Similar to December, the Ottawa zone was the highest priced zone in both the DA and RT markets. The primary driver of high prices in the Ottawa zone was the combination of reduced capacity on a major transmission line and a significant increase in demand for exports to Quebec as the Quebec grid was facing extreme cold weather conditions. The West experienced many hours of extreme negative congestion.
The DA and RT price by zone and by component for the past month is shown below. Prices in both the Northwest and West zones were clear outliers compared to other zones.
OR Prices
There were several real-time Operating Reserve (OR) price spikes near the end of January. The high OR prices at the end of January were occurring at the same time as the high OZPs during these days (due to tight supply across nearby jurisdictions and extreme weather conditions). The average monthly day-ahead 10S price was $37.51/MWh, while it was $25.47/MWh in real-time. OR prices continue to be well above prices in the legacy market. In January, the average day-ahead and real-time OR prices were higher than December. The highest OR price spike of $961.82/MWh occurred at the same hour as the second highest real-time OZP spike was observed. In the day-ahead market, the most common 10S price was $5/MWh while in the real-time market, it was $0.10/MWh.
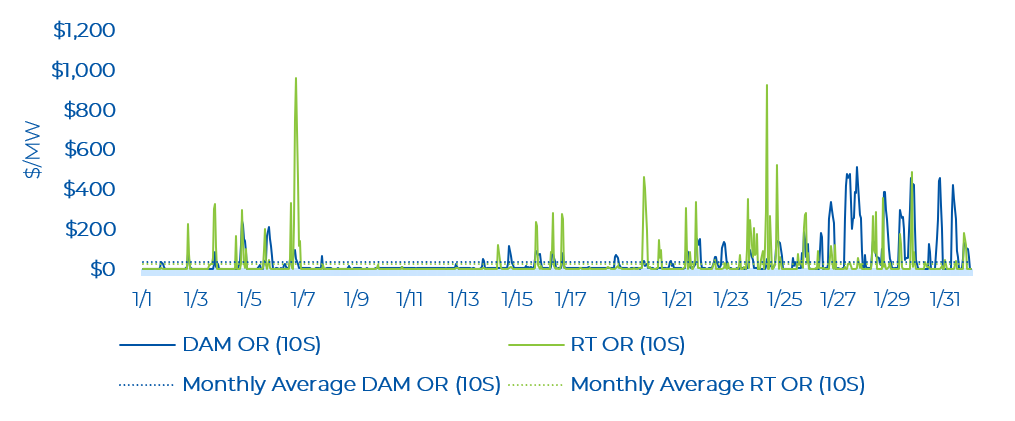
The highest day-ahead OR price was $513.59/MWh, which occurred on January 27, HE 18. The day-ahead energy price was $496.99/MWh at this time. In 27 hours, the day-ahead OR price exceeded the day-ahead energy price. This trend is higher compared with December, where only one hour experienced the OR price exceeding the energy price (i.e. tight reserve market was pulling up energy prices).
Real-time OR prices were low (i.e., near $0.10/MWh) for many hours. There were a few hours with real-time OR price spikes, coincident with real time OZP spikes. The highest real-time OR price was $961.82/MWh on January 6, HE 19. In 12 hours, the real-time OR prices exceeded the real-time energy prices . This is higher compared to December when there were three hours when OR prices exceeded the energy prices.
Zonal Prices and Congestion
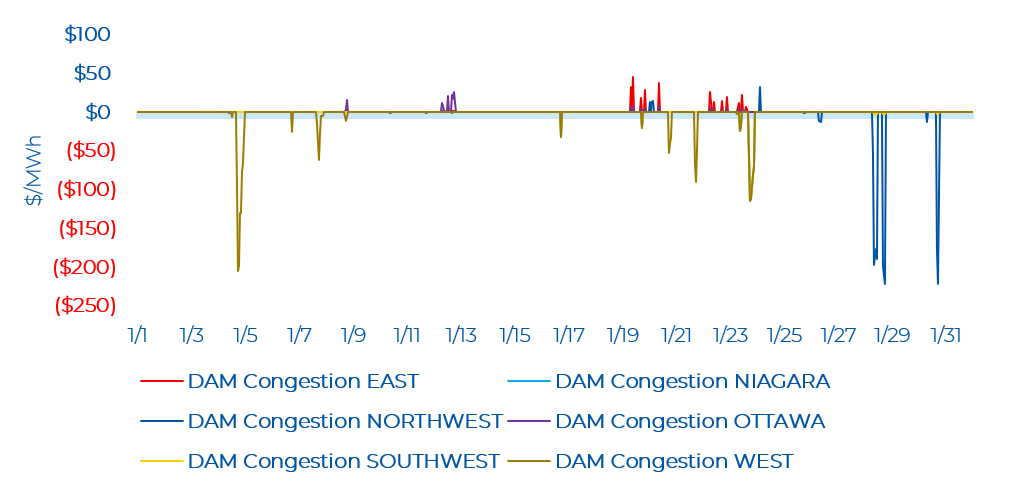
In January, the most congested zones were the Southwest, West, Niagara, and Northwest in the day-ahead time frame. The Southwest zone typically experienced congestion in the same hour as the Niagara, West or the Northwest zones, with the magnitude being similar to the Niagara and West zones and lower than the Northwest. The Southwest zone saw some hours of negative congestion, with a low of -$113.74/MWh. The Niagara and Northwest zones also saw some hours of negative congestion with a low of -$115.13/MWh and -$222.19/MWh, respectively. The West zone saw more hours of negative congestion compared to other zones with a low of -$205.61/MWh. The Ottawa and East zones experienced minor positive congestion. Note that negative congestion typically means there was a constraint exporting energy from a particular zone, while positive congestion is the opposite.
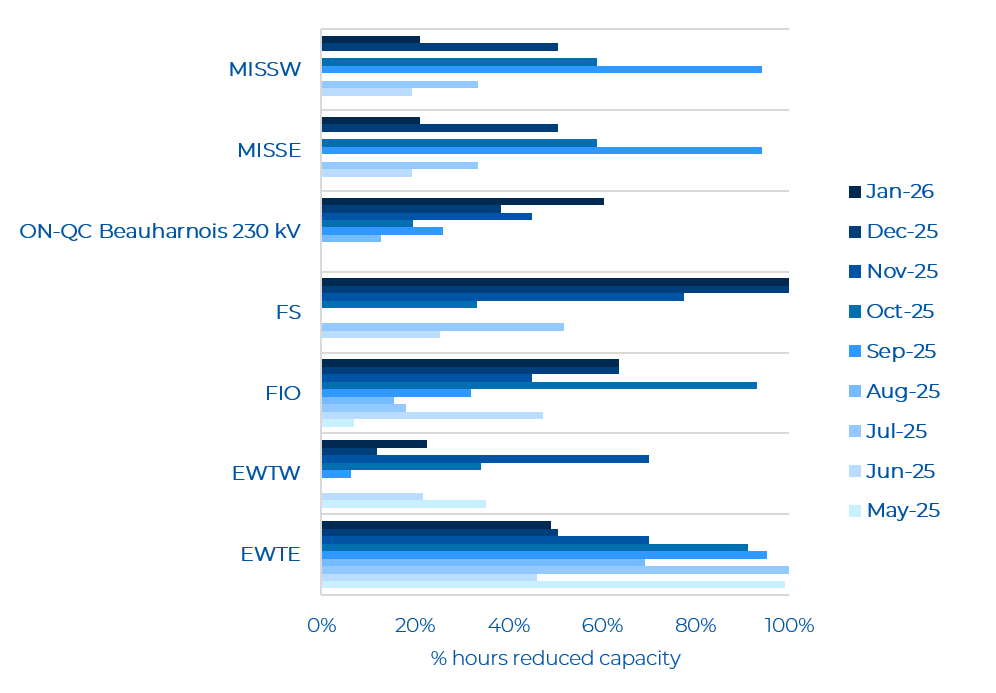
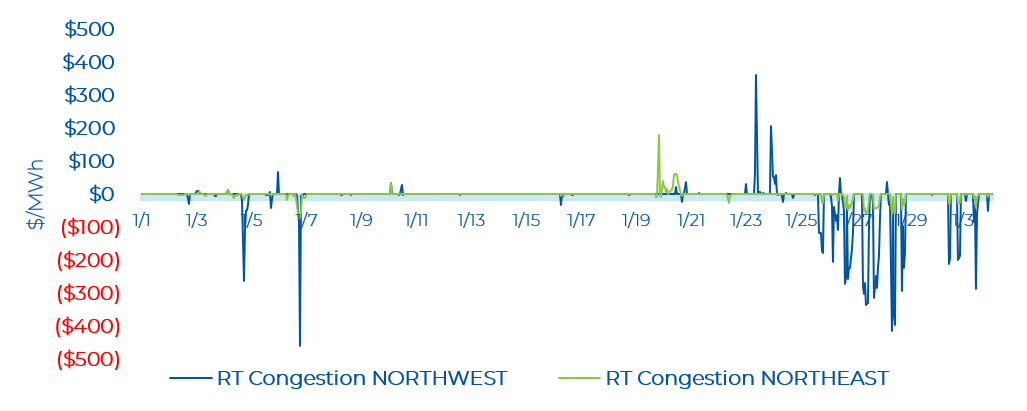
Real-time congestion in the Northwest zones was high for the end of January observing both positive and negative congestion. The highest congestion in the Northwest was $362.11/MWh (on January 23, HE 10) with a low of -$458.43/MWh (on January 6, HE 19 – also second highest RT OZP). The Northeast zone saw congestion hit a high of $178.61/MWh (on January 19, HE 21) and a low of - $74.32/MWh (on January 6, HE 18 – close to the second highest RT OZP). From a transmission perspective, there were outages on major northern interfaces: East-West Transfer East (EWTE)/East-West Transfer West (EWTW), Flow South (FS), and the Mississagi Flow West (MISSW)/Mississagi Flow East (MISSE).
Other than the Northern zones, in real time, the West zone saw some hours of consecutive negative congestion. The West zone observed a low of -$1,061.31/MWh of congestion which occurred at the same hour as the second highest RT OZP spike (on January 6, HE 19). This is the most extreme case of negative congestion in that zone since the renewed market launched. In this hour, Ontario demand dropped by 570 MW and there was a 500 MW and 550 MW outage on the Ontario-Michigan export and import interfaces respectively. As a result, there was excess supply in the West zone, resulting in negative congestion. For reference the RT zonal price for the West zone was $72.44/MWh while the RT OZP was $1,031.08/MWh.
The Ottawa and East zones mainly observed congestion at the same hours. There were three extreme congestion hours (above $400/MWh) for Ottawa, two on January 16 HE 16 and HE 17 and one on January 21, HE 16. Exports to Quebec increased by 100 MW from HE 16 to HE 17 on January 16 and increased by 895 MW on January 21 HE 16 (where the max monthly export to Quebec was observed). Additionally, on January 16, there was reduced capacity on the Flow Into Ottawa (FIO) interface and the Ontario-Quebec Beauharnois Import (ON-QC Beauharnois) interface. The FIO interface had a 350 MW outage (i.e. operating at a minimum of 88% of its All-In-Service limit) and the ON-QC Beauharnois interface had a 400 MW outage (i.e. operating at a minimum of 49% of its All-In-Service limit). From January 17 to January 26 and from January 30 to January 31, the ON-QC Beauharnois interface was on full outage. Hourly imports from Quebec to Ontario were therefore very low these days. The increased exports and reduced interface capacity occurrences likely led to the extreme congestion observed in the Ottawa and East zones.
Separately, the full outage on the ON-QC Beauharnois interface and the major outage experienced in Quebec likely led to the extreme congestion conditions experienced by several zones in Ontario in the last week.
The Niagara zone had a low number of moderate negative and positive congestion hours. The Niagara zone saw a low of - $70.24/MWh (also on January 23, HE 16). At this hour, the Southwest and West zones saw a similar magnitude of congestion. Similar to the day-ahead time frame, the Southwest zone experienced congestion at the same time as the Niagara, West or the Northwest zones.

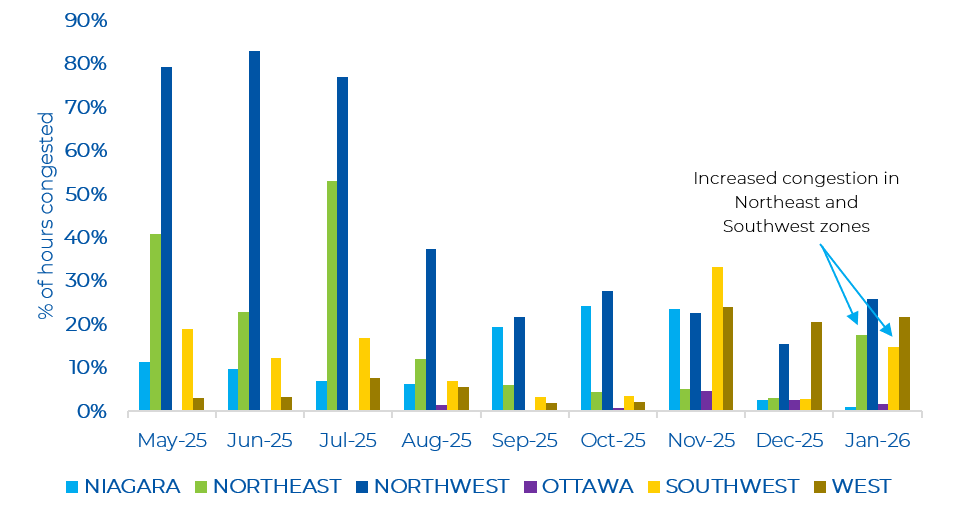
In January, the Northwest, Northeast, Southwest, and West zones saw an increase in the number of congested hours compared to December. In particular, there was a significant rise in the number of congested hours for the Southwest and Northeast zones. High congestion in the West zone has also been persistent from November to now.
As shown in the figure below, similar to December, January saw many northern major interfaces with reduced capacity. The EWTE/EWTW, FS, and FIO continued to show reduced capacity in January. In contrast to December, the number of hours with reduced capacity on the MISSE/MISSW reduced by half. One key takeaway is January had the greatest number of hours with reduced capacity on the ON-QC Beauharnois interface.