Ontario demand hit its highest level since 2007 – reaching 25,646 MW on July 14, HE 17. This summer’s peak demand was also 784 MWs higher than the peak demand in 2025.
Day-Ahead and Real-Time Price Trends by Components and by Zone
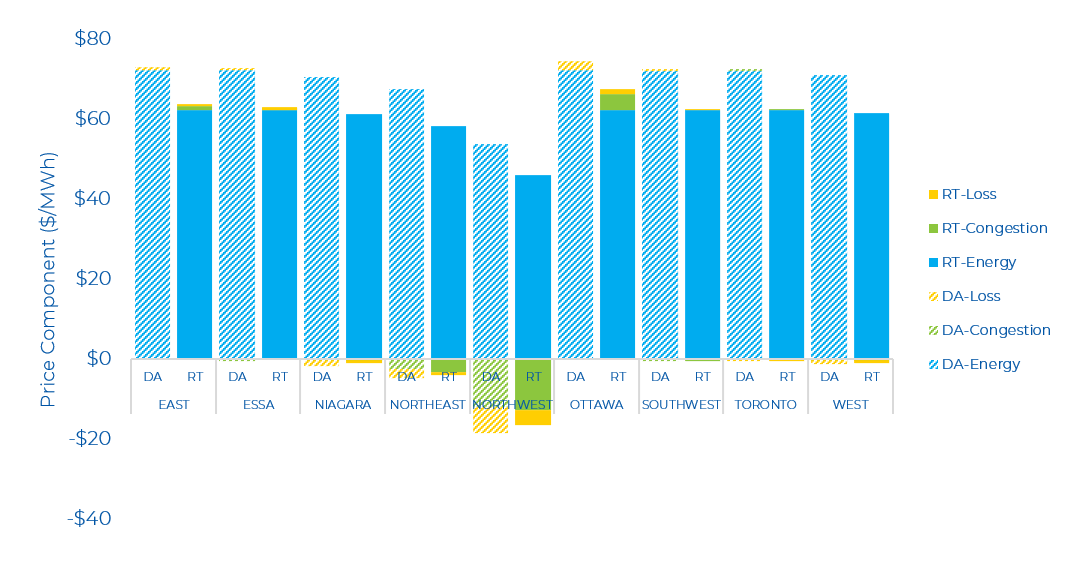
In July, Ontario’s wholesale market experienced higher prices across all zones in day-ahead compared to real-time. Similar to previous months, the Northern zones showed low prices while the Ottawa zone posted the higher average price compared to all other zones. DA zonal prices ranged from $54/MWh (Northwest) to $74/MWh (Ottawa), while Real-Time (RT) zonal prices ranged between $46/MWh (Northwest) to $67/MWh (Ottawa).
The DA and RT price by zone and by component for the past month is shown below. Prices in the Northern zones and Ottawa zone were mainly impacted by congestion due to reduced capacity on major transmission interfaces.
Day-Ahead and Real-Time Prices
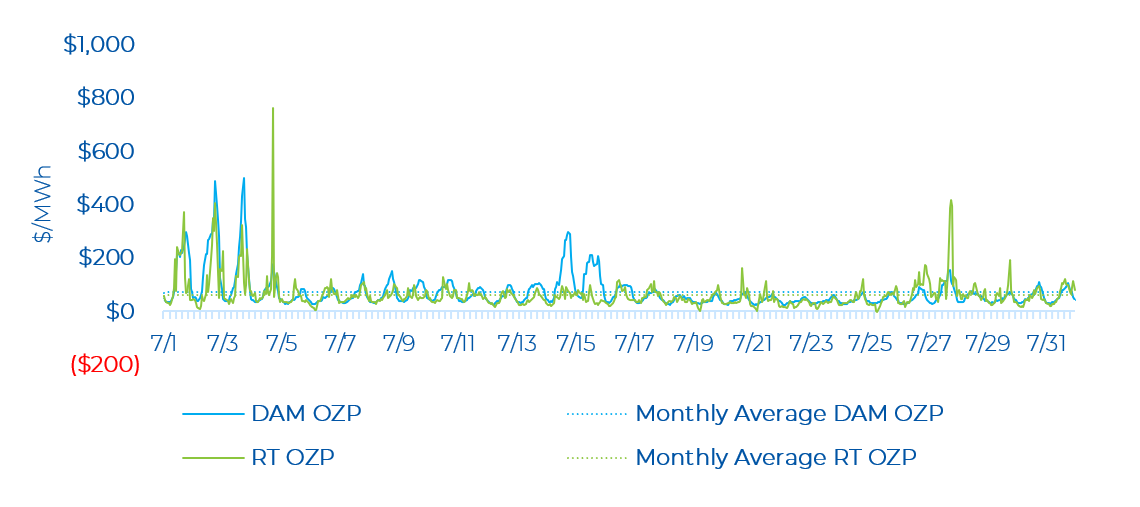
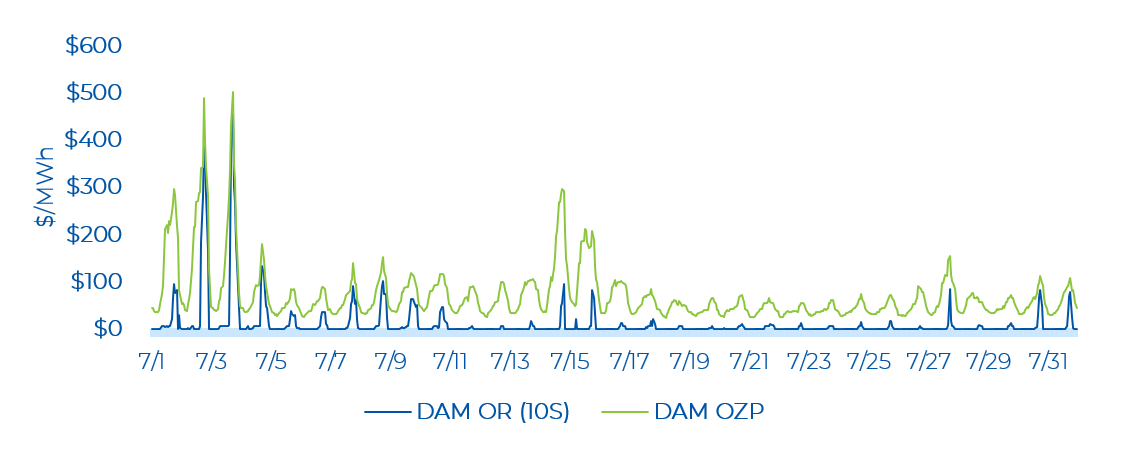
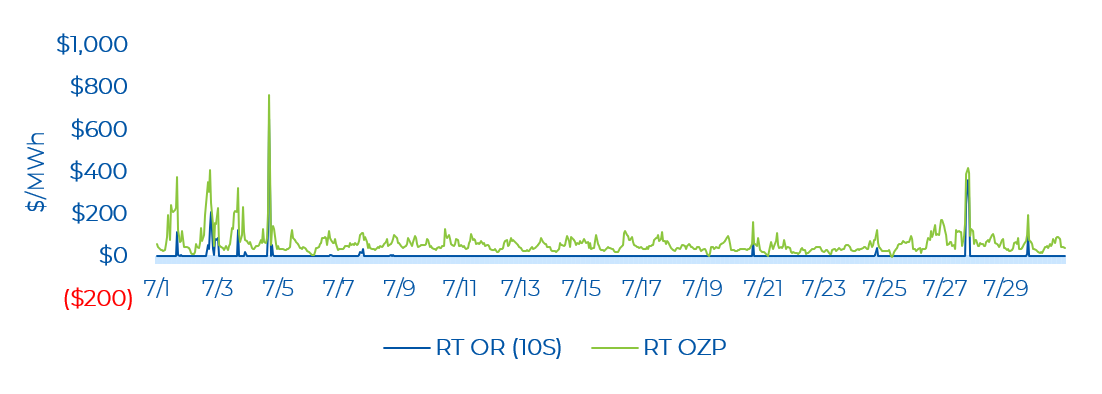
As noted, July set the highest Ontario demand since 2007. The peak demand in July was 2,120 MW higher than the peak in June. Ontario demand on July 4, HE 18 – when OZP hit its highest level – was 21,416 MW. Compared to June, July had more frequent higher hours where prices breached $200/MWh, as well as a higher monthly average price. There were 22 real-time hourly OZP spikes greater than $200/MWh. The average hourly day-ahead OZP was $72.25/MWh in July, while the real-time OZP was $62.44/MWh. The highest real-time OZP was $761.92/MWh (on July 4, HE 18).
OR Prices
The average monthly day-ahead 10S price was $10.44/MW, while it was $4.28/MW in real-time. The highest real-time OR price spike was $650.38/MW and occurred at the same hour as the highest real-time OZP spike. In the day-ahead market, the most common 10S price was $0.10/MWh (occurring 43% of the time). In the real-time market, the most common 10S price was $0.09/MWh (occurring 21% of the time). The overall decrease in OR prices is likely due to increased generation from energy storage resources. In July, there was about 85 GWh in energy storage output – surpassing June’s output of 79 GWh and marking the highest total amount of monthly storage output since the launch of the renewed market (or the wholesale market in 2002).
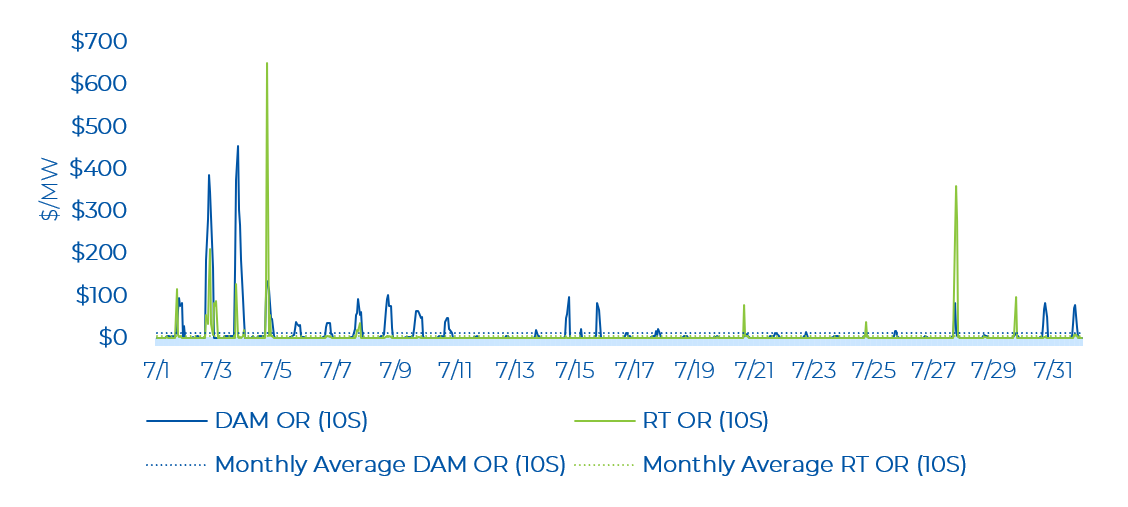
The highest day-ahead OR price was $454.85/MW, which occurred on July 3, HE 18. The day-ahead energy price was $501.53/MW at this time. The day-ahead OR price did not exceed the day-ahead energy price in any hours in July. This trend is different from June, where 15 hours (2% of total hours) had the OR price exceeding the energy price – meaning that in these hours the OR market was tight and reserve prices put upward pressure on energy prices due to co-optimization.
Real-time OR prices were low (i.e., near $0.09/MW) for many hours. There were some hours with real-time OR price spikes, coincident with real time OZP spikes. The highest real-time OR price was $650.34/MW on July 4, HE 18. In contrast to June, the real-time OR prices exceeded the real-time energy prices across 2 hours or 0.3% of total hours in July. This is lower compared to June where 5 hours or 1% of total hours OR prices exceeded the energy prices.
Zonal Prices and Congestion
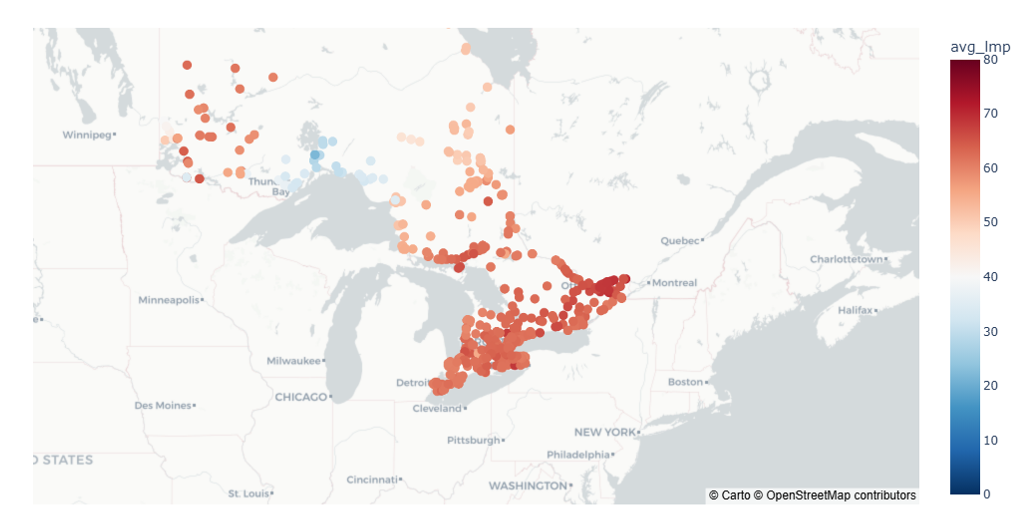
The average real-time nodal price (LMP) across Ontario for July is shown in the figure below. In contrast to June, all nodes across Ontario are elevated in price. There is also less of a divergence in the LMPs in the northern zone vs other zones in the rest of Ontario in July compared to June. Nonetheless, there remains a very clear divide in energy prices between the Northwest and the rest of the province.
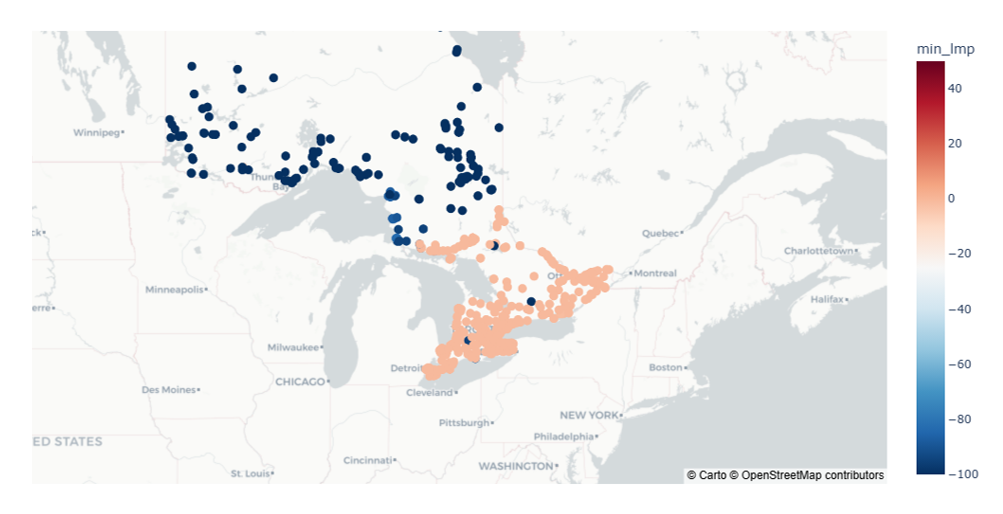
Similar to June, in July the nodes in the Northern zones had much lower LMPs compared to other zones. However, the LMPs in July nearly reached -$100/MWh compared to -$40/MWh in June.
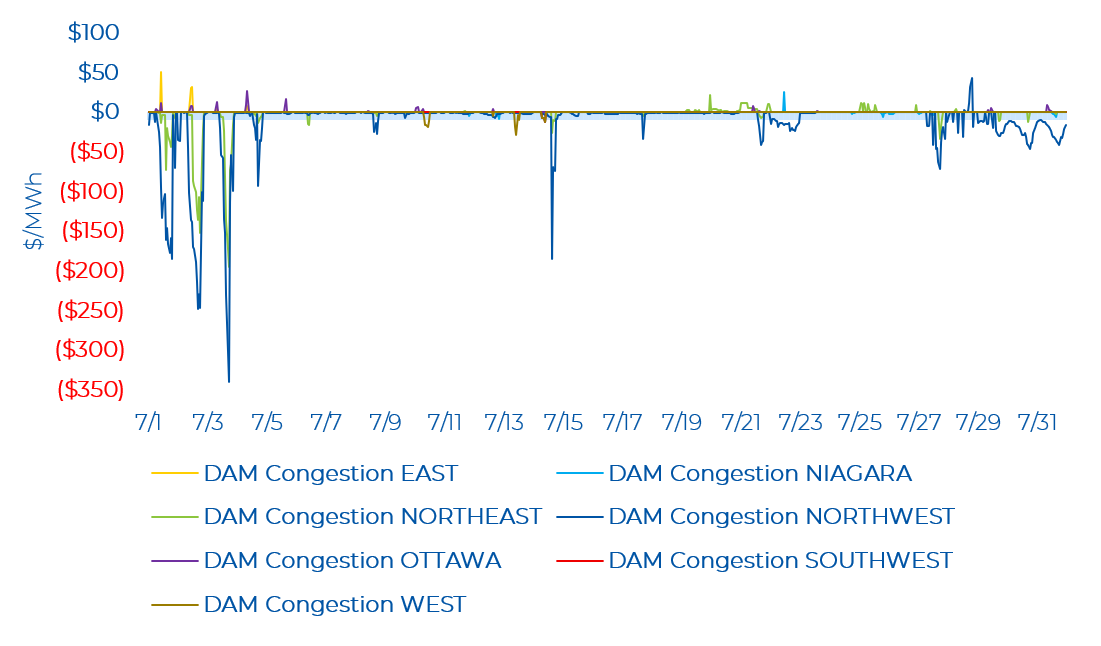
In July, there was moderate congestion across several zones in the day-ahead market. The Northwest zone saw the most hours of congestion with a low of - $340.12/MWh. The Northeast zone also observed mainly negative congestion with a low of - $194.64/MWh. Congestion in the East and Ottawa zones occurred mostly at the same hours at a few hours throughout the month. The East and Ottawa zone saw a high of $50.77/MWh and high of $27.05/MWh respectively. The Niagara zone saw both positive and negative congestion. The Southwest and West zone saw minor hours of negative congestion. Note that negative congestion typically means there was a constraint exporting energy from a particular zone (and lower energy prices), while positive congestion is the opposite.
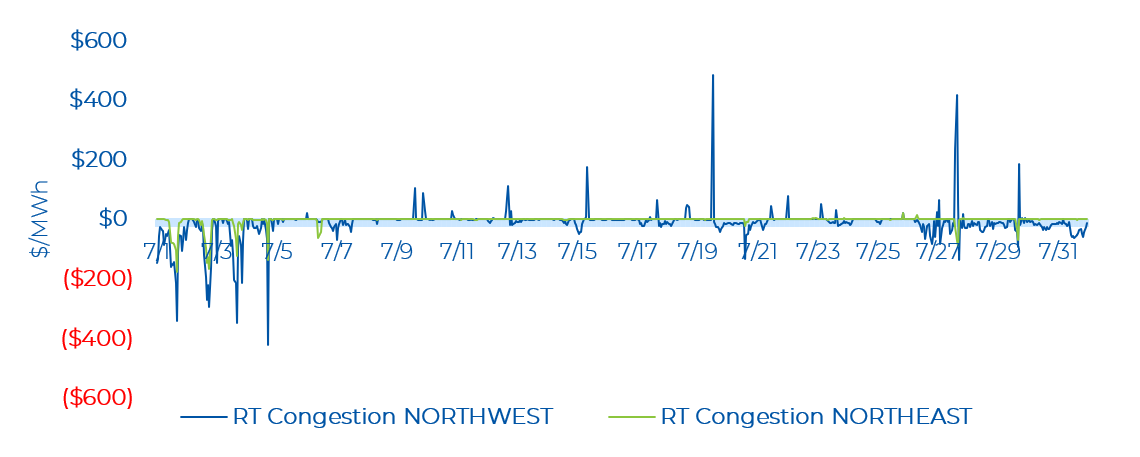
In real-time, the Northwest and Northeast zones saw several hours of both positive and negative congestion in July. The Northwest zone saw a high of $483.60/MWh in congestion and a low of - $421.78/MWh. The Northeast zone saw a high of $23.04/MWh and a low of - $175.86/MWh. The lowest congestion observed in the Northwest zone in July was at the same hour as the highest RT OZP observed.
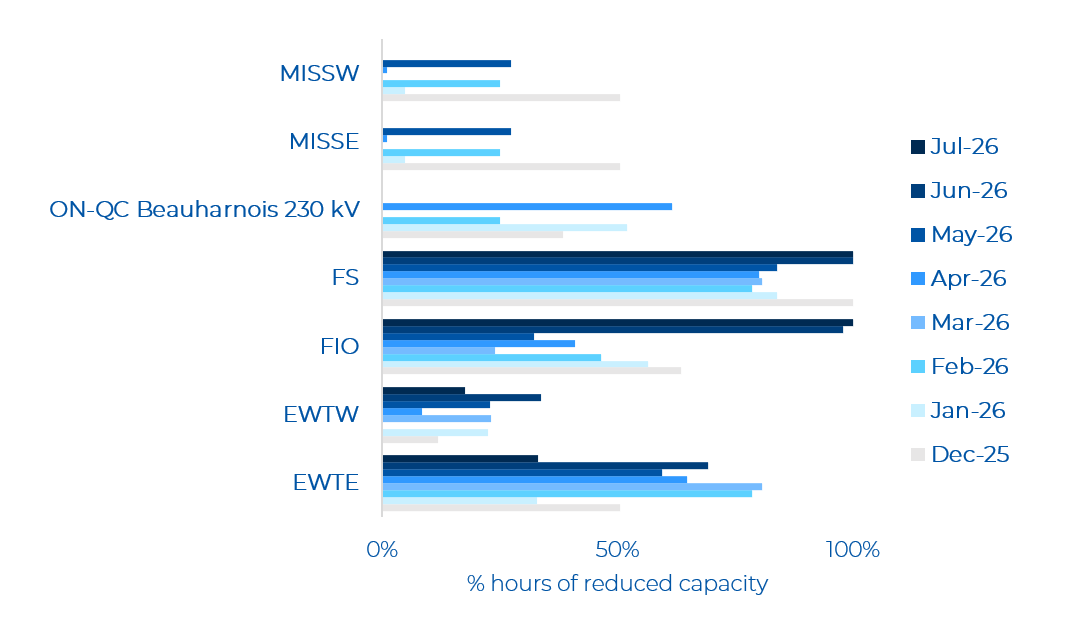
For several hours in July, there were outages on the East-West Transfer East (EWTE)/East-West Transfer West (EWTW), St Lawrence West, and Flow Into Ottawa (FIO) interfaces. There were also some outages on the Flow-South (FS) and Flow-North (FN) in the end of the month while other hours showed that these interfaces continued to operate at minimum capacity for July. Outages on these interfaces impacted the congestion observed in these zones.
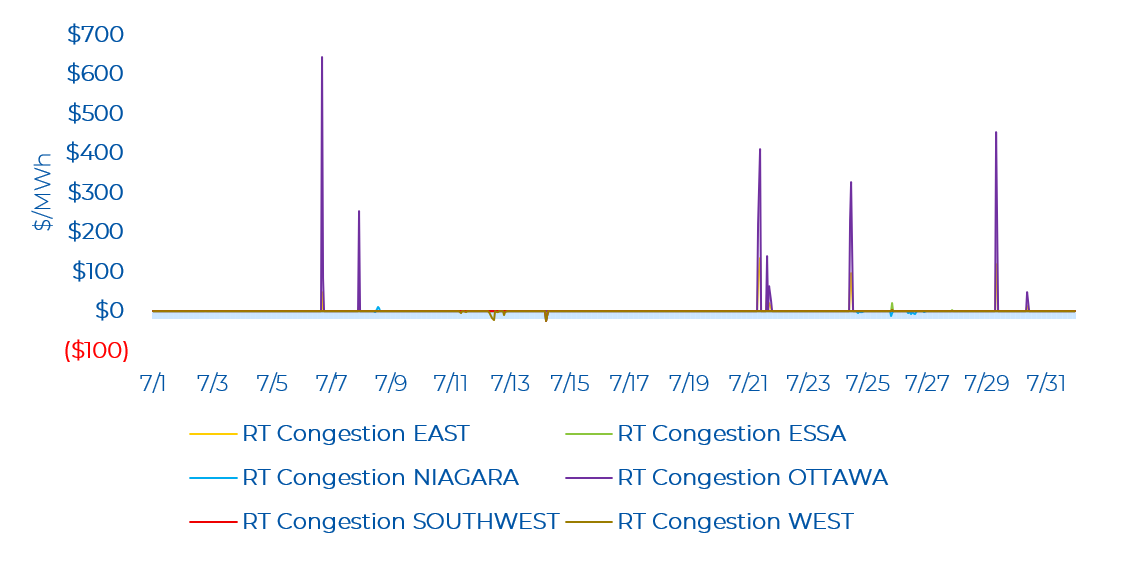
Other than the Northern zones, in real time, there was high positive congestion in the Ottawa zone at the same time as the East zone. The Ottawa zone observed a few spikes above $100/MWh with a high of $654.03/MWh. The highest spike of congestion observed happened at an hour where Ontario demand increased by more than 600 MW, imports dropped significantly from the previous hour, and the FIO was operating at 500 MW less than its all-in service (AIS) limit. The Niagara zone saw minor negative congestion with a high of $10.99/MWh and a low of -$24.21MWh. The Essa zone had minor congestion with one hour sharing a similar congestion value observed in the Northeast and Northwest zones. The Southwest and West zone had mainly minor negative congestion with a low of -$24.21/MWh, identical to low observed in the Niagara zone.
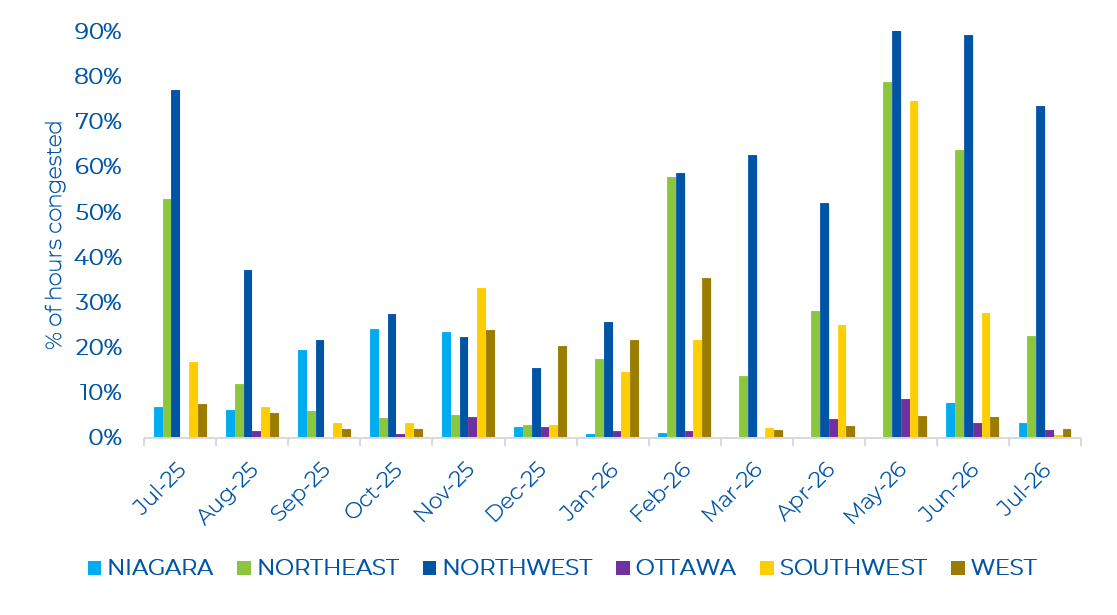
In July of this year, the Northern zones saw a high number of congested hours, which was similar to July of last year as well as the previous month (June). From June, the number of congested hours in the Southwest and West zone has dropped. Some congestion in the Ottawa zone was still observed in July.
As shown in the figure below, July, similar to June, had reduced capacity on the FS and FIO interfaces. In contrast to June, there was less instances of reduced capacity on the EWTW/EWTE interfaces.