Note: We have transitioned to providing monthly reviews of the renewed IESO-Administered Market (IAM). For clients interested in weekly or daily reviews, please do reach out to Power Advisory.
Day-Ahead and Real-Time Price Trends by Components and by Zone
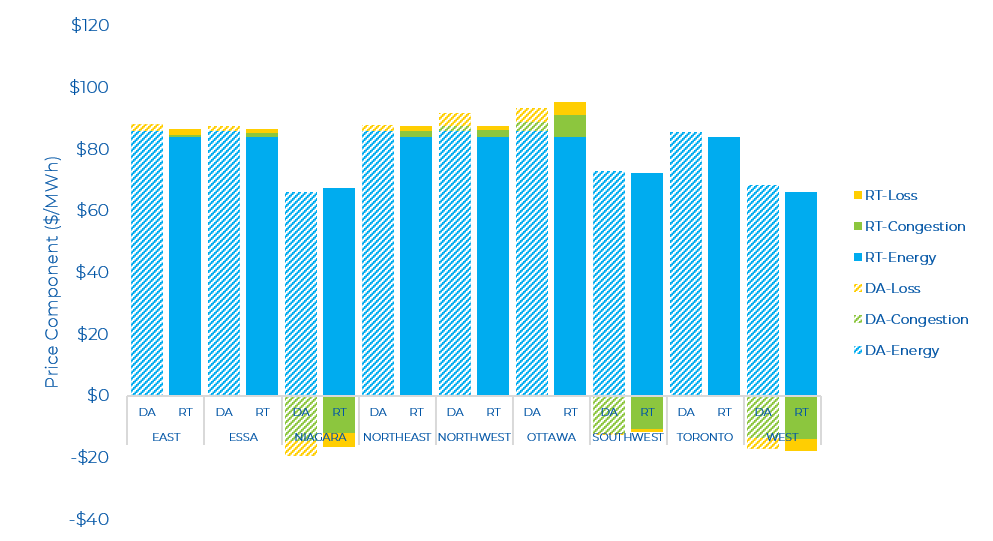
For the month of November, the average Day-Ahead (DA) zonal prices ranged from $77/MWh (Niagara) to $93/MWh (Ottawa), while Real-Time (RT) zonal prices ranged between $48/MWh (West) to $95/MWh (Ottawa). There were a few notable changes in pricing across the IAM in November. First, the Ottawa zone was the highest priced zone in both the DA and RT markets. The primary driver of high prices in the Ottawa zone was reduced capacity on a major transmission line, which can limit supply into the zone. Second, there was considerable negative congestion across the Niagara, Southwest and West zones.
The DA and RT price by zone and by component for the past month is shown below.
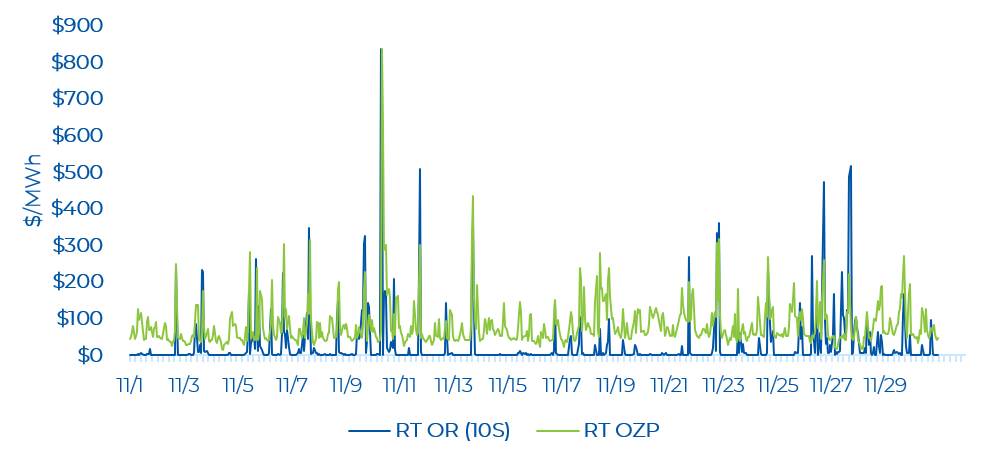
Day-Ahead and Real-Time Prices
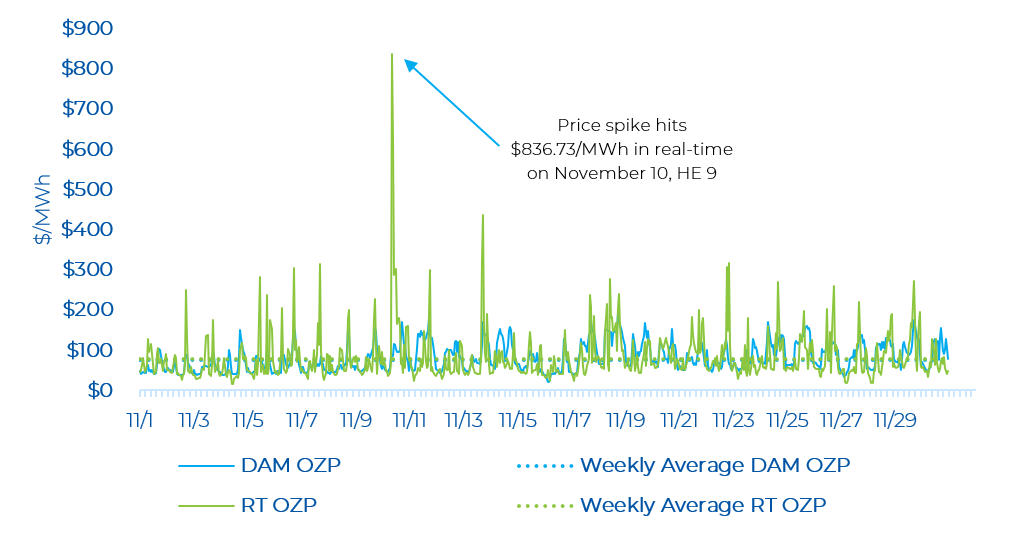
The average hourly day-ahead OZP was $82.01/MWh in November, while the real-time OZP was $80.82/MWh. There were 29 real-time hourly OZP spikes greater than $200/MWh in November. Most of these price spikes occurred in morning or evening hours when demand is changing rapidly. The highest real-time OZP was $836.73/MWh (on November 10, HE 9). Very negative congestion was also seen across the Niagara, Southwest, and West zones. We provide a more detailed review on congestion in later sections of this review. The real-time OZP for the next fours hours on November 9th (HE 10 to HE 13) were also high (i.e. above $200/MWh) – a result of a tight supply/demand balance and high congestion. The peak Ontario demand in November was 19,731 MW (on November 10, HE 18). In October, the peak Ontario demand was 20,335 MW. The Ontario demand on November 10, HE 9 – when OZP hit its highest level – was 18,643 MW, which is well below the more than 24,000 MW peak demand Ontario experienced in the summer.
OR Prices
There were several real-time Operating Reserve (OR) price spikes in November. The average monthly day-ahead 10S price was $16.29/MWh, while it was $24.39/MWh in real-time. OR prices continue to be well above prices in the legacy market. OR prices in November were higher than October when the OR prices in both markets were on average below $13/MWh. The highest OR price spike of $835.56/MWh occurred one hour prior to the highest real-time OZP spike observed in November. In the day-ahead market, the most common 10S price was $5/MWh while in the real-time market, it was $0.20/MWh.
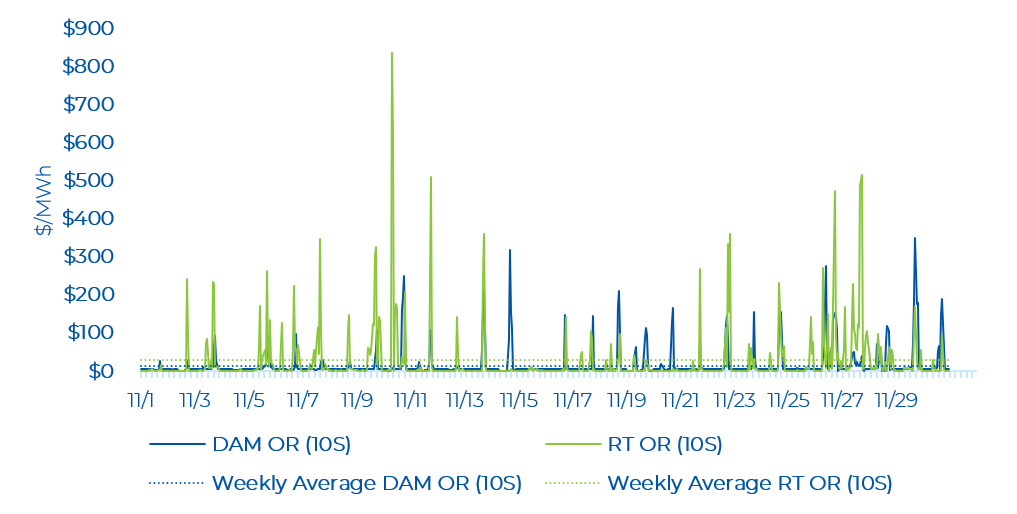
The highest day-ahead OR price was $350.10/MWh, which occurred on November 29, HE 18. The day-ahead energy price was $173.99/MWh at this time. When OR prices are higher than energy prices it is typically the result of a tight reserve market that is pulling up energy prices.
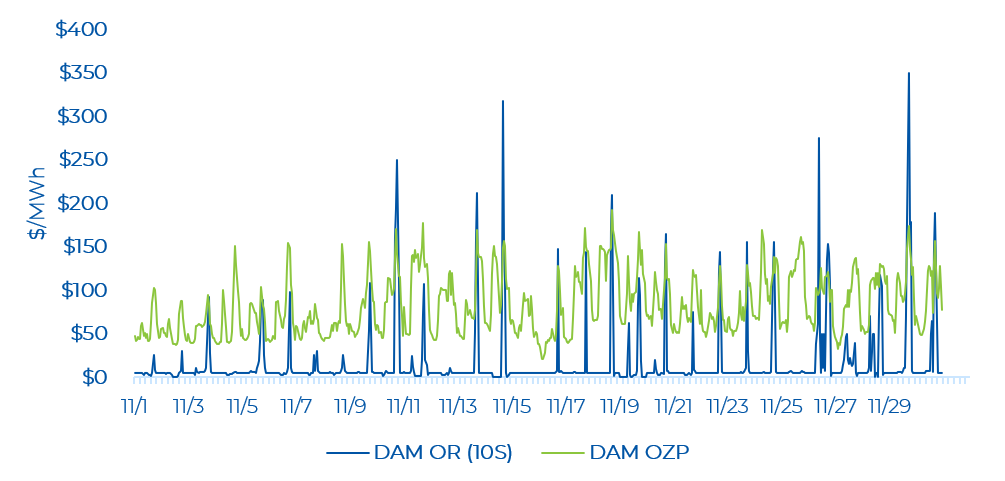
Real-time OR prices were low (i.e., near $0.20/MWh) for many hours. There were several real-time OR price spikes in November, coincident with real time OZP spikes. The highest real-time OR price was $835.56/MWh on November 10, HE 8.
Zonal Prices and Congestion
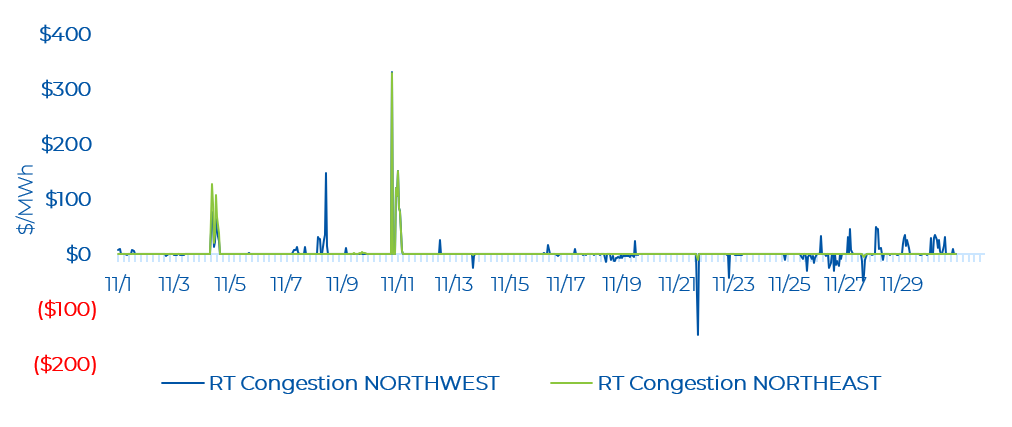
In November, the most congested zones were Niagara, Southwest, and West in the day-ahead time frame. These zones frequently observed the same magnitude of congestion at the same hour, with several negative congestion hours. This means that nearly half of southern Ontario’s electricity grid was experiencing congestion. The Niagara, Southwest, and West zones saw a low of -$104.15/MWh, - $103.30/MWh, and -$104.15/MWh respectively. Ottawa zone experienced a significant amount of positive congestion in the first week of November. The Northwest zone saw a couple hours of mainly positive congestion, with minor negative congestion. The Essa and Northeast zone saw only one hour of positive congestion (on November 11, HE 1).

Real-time zonal prices in the Northwest zone remain volatile – with the Northwest seeing swings from negative to positive congestion, although the positive congestion tends to be higher in magnitude. The Northwest saw a high of $330.27/MWh (on November 10, HE 20) and low of -$147.18/MWh (on November 21, HE 18). On the other hand, the Northeast zone saw a couple of hours of positive congestion, with a high of $329.32/MWh (also on November 10, HE 20 like the Northwest zone).
Similar to day-ahead, in real time, the Niagara, Southwest, and West zones observed identical congestion. The three zones saw a low of about -$426.55/MWh to -$430.41/MWh. This was observed on the same hour (November 10, HE 9) as the real-time OZP price spike – which is calculated as a load-weighted average of all nodal prices. At this hour, the Flow South (FS) interface connecting the Northeast and Essa zones had 350 MW of reduced capacity (i.e. operating at 83% of it’s All-In-Service limit). The reduced capacity of this transmission interface as well as a rapid change in demand, may have contributed towards the simultaneous negative congestion across these zones. Note, that these zones are all neighbouring to one another. The Ottawa zone saw the lowest congestion to date of -$1,279.18/MWh on November 3, HE 18. Exports to Quebec at this hour were 1,229 MW (about 63% of its hourly max export level to Quebec in November) while the Flow Into Ottawa (FIO) interface had a 650 MW outage (operating at 78% of its All-In-Service limit) and the Ontario-Quebec Beauharnois intertie had a 400 MW outage (operating at 49% of its All-In-Service limit). In the first two weeks of November, the FIO had an outage ranging with its capacity being 78% to 90% of its All-In-Service limit while the Ontario-Quebec Beauharnois intertie had less outages but occurring at 49% of its All-In-Service limit. A couple hours of mainly positive congestion were seen in the East Zone with a high of $106.18/MWh. The Essa zone saw a couple hours of consecutive positive congestion (mainly on November 10) with a high of $301.11/MWh.
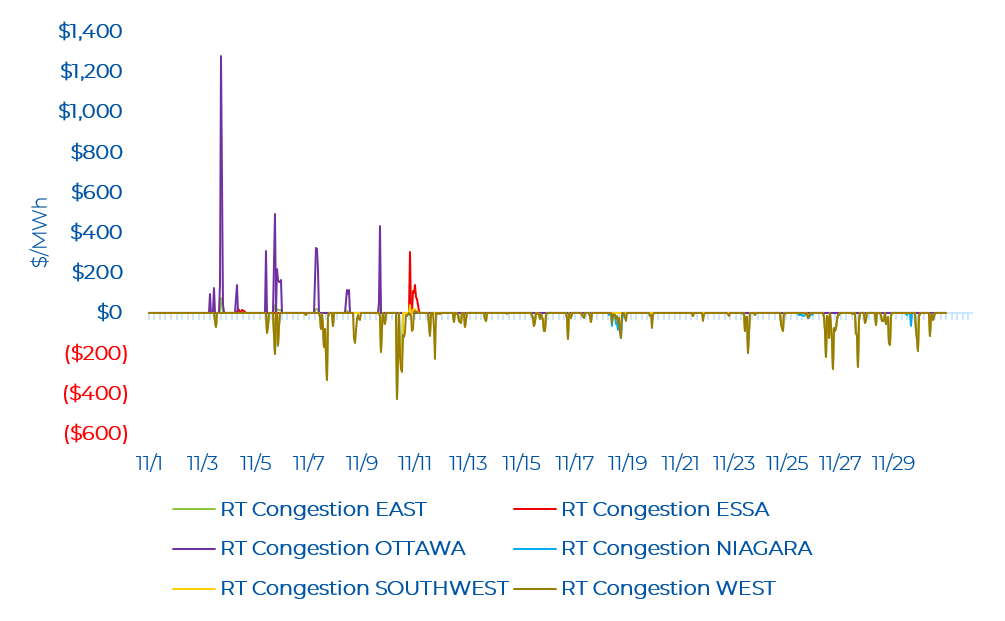
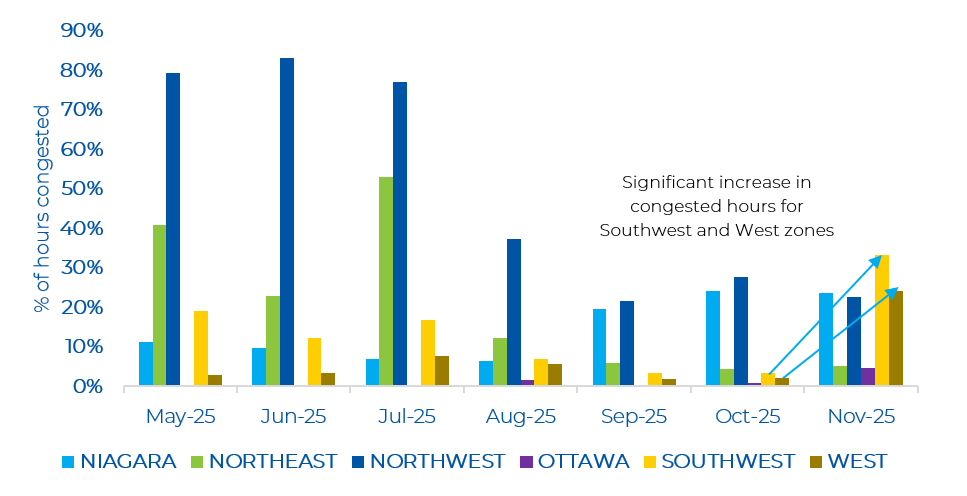
Note for the month of November, the Ottawa, Southwest, and West zones saw the greatest number of congested hours since the launch of the renewed market. The Niagara zone also saw a high number of congested hours, but similar to what was observed in October.
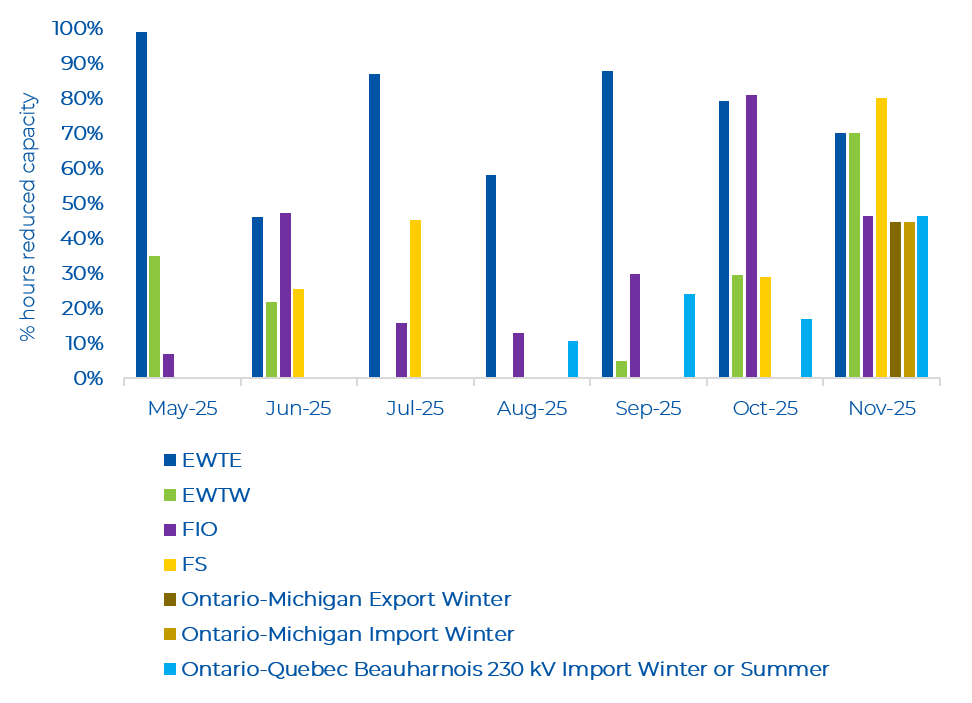
In the figure below, the Northwest-zone connected transmission interfaces: East-West Transfer East (EWTE)/East-West Transfer West (EWTW) continue to show a high number of hours of reduced capacity in November compared to October. Flow South (FS) connecting Northeast and Essa, Ontario-Michigan interface connecting West and Michigan, and Ontario-Quebec Beauharnois connecting Ottawa and Quebec, had the highest hours of reduced capacity in November compared to previous months since the launch of the renewed market. Flow Into Ottawa (FIO) connecting the East and Ottawa zone, also showed a large number of hours with reduced capacity. As noted previously, for the Ottawa zone, congestion was likely influenced by the reduced capacity on the FIO interface (in addition to high exports into Quebec at some hours ). For the Niagara, Southwest, and West zones, from a transmission lens, FS had shown reduced capacity at all hours when these zones seen high negative congestion (lower than -$20/MWh). IESO states that FS transfer capability is important for delivery of imports and supply from the Northwest and Northeast Zones to the rest of the province. As these three zones are either major load zones (Southwest and West) and/or are important for delivery of exports to nearby jurisdictions (West and Niagara), it is likely that the reduced capacity of FS is limited flow of supply into these zones leading to very negative congestion.