The Financial Impact of the Two-Settlement System for TX-connected Wind Facilities
Power Advisory undertook an analysis to better understand the implications of the new two-settlement system for merchant wind facilities in Ontario. Given the lack of public data regarding day-ahead schedules for individual units, Power Advisory undertook a more high-level approach to highlight the risk/benefit of the two-settlement system for intermittent generators operating on a merchant basis. Existing contracted facilities are fully protected from the Day-Ahead to Real-Time risk, while the contracts for the LT2 procurement introduce some risk for participants. As such, Power Advisory’s analysis is illustrative only and limited by the lack of data published by the IESO.
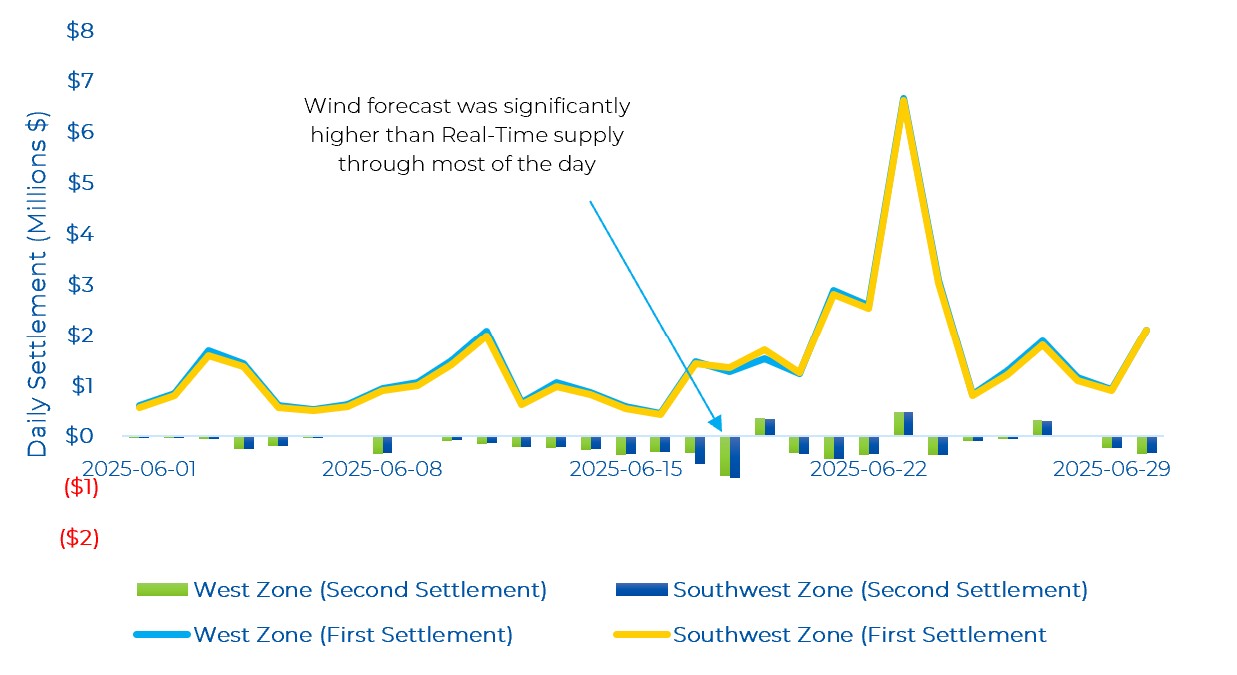
The first step of the analysis looks at the Day-Ahead schedule for the entire TX-connected wind fleet in Ontario (as noted, schedules for individual generators are not available). We then look at the Real-Time supply of the TX-connected wind fleet. The next step is to look at two Locational Marginal Price (LMPs) nodes to calculate the financial impact – negative or positive – for wind facilities that over- or under-generate in Real-Time compared to their Day-ahead schedule. Power Advisory utilized two nodes – one in the West zone (North Kent) and one in the Southwest zone (Armow). We focused on these two nodes, as they represent some of the largest wind facilities in the two zones with the most transmission-connected wind capacity.
With the available data, Power Advisory then calculated the total settlement, which includes the first settlement (Day-Ahead supply times the LMP) and the second settlement (difference between the Day-Ahead and Real-Time supply times the Real-Rime LMP). The analysis utilizes supply from the entire wind fleet to calculate the impact of divergences between the two schedules – recognizing that each wind facility would have its own Day-Ahead and Real-time schedule – as individual data is not available. Given this limitation, the calculations that follow are illustrative and would differ for each asset.
The analysis shows that for the month of June, the two-settlement system for TX-connected wind facilities operating on a merchant basis – i.e. with no contract protection – would see their Day-Ahead revenues reduced as a result of the two-settlement system. Essentially, the revenue clawback in hours when Real-Time supply is below the Day-Ahead schedule is greater than the increase in revenue when Real-Time supply is greater than the Day-Ahead schedule. The LMP in hours when the wind fleet is under-producing in Real-Time is typically higher than when the wind fleet is over-producing in Real-Time.
The following graph shows the first settlement amounts for each day and the second settlement amounts, which would increase or decrease the total settlement (i.e. First + Second settlement). The biggest impact came on June 18th when Real-Time supply was below the Day-Ahead schedule for most hours of the day – and in some hours incorrect by more than 1,800 MWs (of the 2,700 MW that was scheduled in Day-Ahead). For the entire month, total revenues in both the West and Southwest zones would have been reduced between 10 and 11% due to the clawback in Real-Time as part of the two-settlement process.
As with previous commentary on MRP, Power Advisory recognizes that this analysis is based on limited data and it may change as we move through multiple seasons and the pricing dynamics of the market change. Nonetheless, we do find it useful to highlight the financial implications of the two-settlement system and financially binding Day-Ahead Market for intermittent resources using the IESO forecast.
Day-Ahead and Real-Time Prices
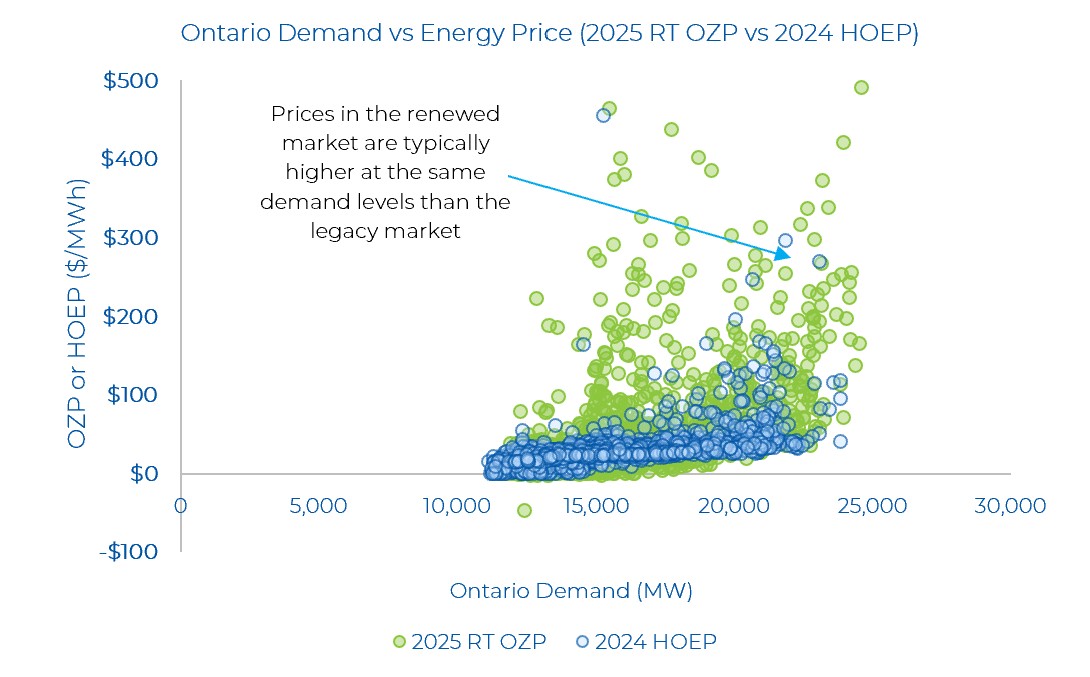
Volatility in the renewed market has been a frequent topic for our newsletter. To show the current trends of the new MRP market compared to the legacy market (i.e., 2025 to 2024), Power Advisory layered hourly-level Ontario Demand and real-time Ontario Zonal Price (OZP) data with HOEP data published from May 1 to July 20 in the previous year. The most striking contrast is the volatility of energy prices in the renewed market. There are several prices above $200/MWh even when demand is fairly moderate as well as generally higher priced hours when demand is above average. Note that the figure is set to show energy prices up to $500/MWh but there have been real-time energy prices in the renewed market that have reached up to $1229.23/MWh. As the market progresses and the day-ahead and real-time energy prices converge, a more conclusive trend on the changes in energy prices with respect to demand can be made.
Looking at last week’s day-ahead and real-time prices, real-time energy prices were very volatile and there was much less convergence between the day-ahead and real-time energy prices. Real-time prices diverged materially from day-ahead prices on the first day (July 14) and middle days (July 17 and July 18) of the week. There were 6 real-time OZP spikes greater than $200/MWh, with the highest price hitting $371.97/MWh (on July 16, the hottest day of the week). The peak demand last week was 23,611 MW (also on July 16). The price spikes occur in hours where demand is changing quickly.
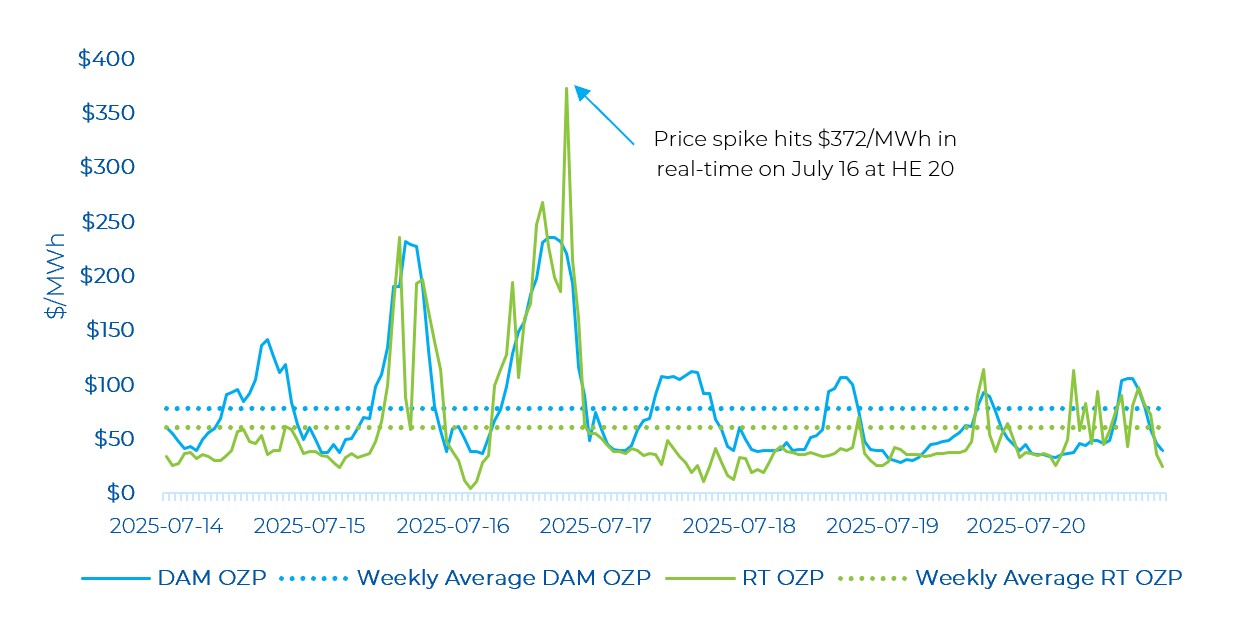
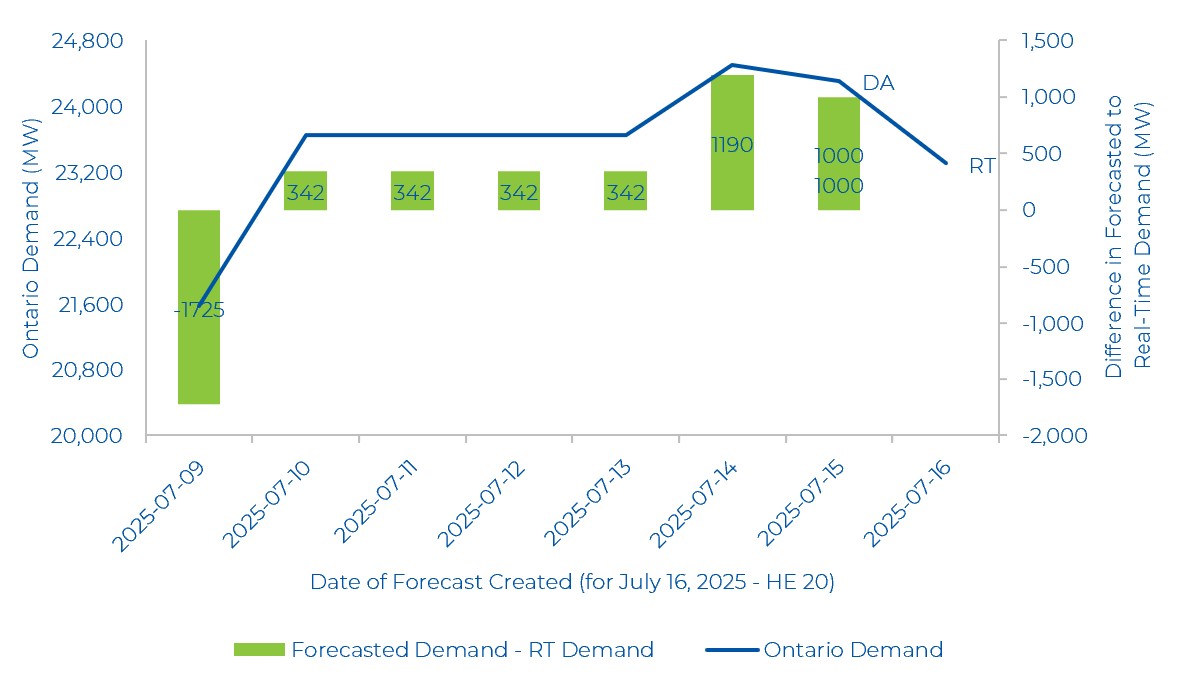
From a forecasted versus real-time demand perspective, at the peak real-time price hour, the IESO over forecasted real-time demand by 1,000 MW in the day-ahead time frame. The figure below shows 7 days of forecasted demand in the Adequacy Report for July 16, 2025 at HE 20 (i.e. this looks at the previous 7 days of forecasts for HE 20 July 16th). Throughout the week leading up to this hour, demand was forecasted to be -1,725 MW lower to 1,000 MW higher in day-ahead compared to real-time. Hence, the price spike is less related to the large divergence between the day-ahead to real-time market as there were likely more resources committed in the day-ahead than required in real-time.
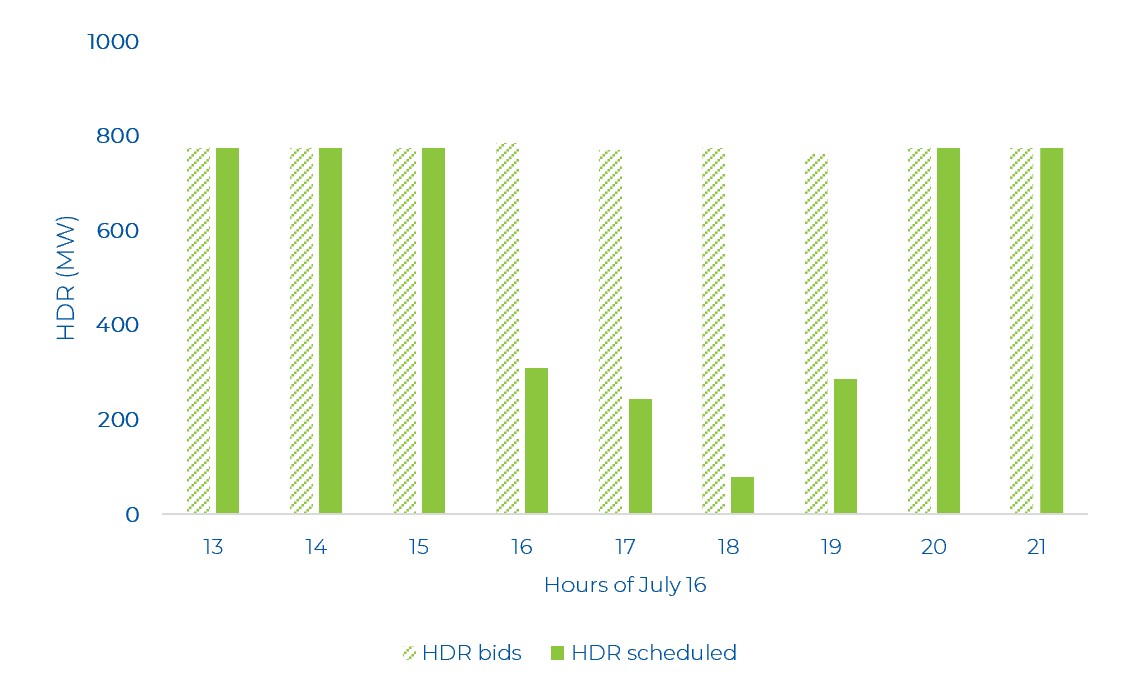
Last week, there were also several hours where hourly demand response (HDR) resources were “scheduled on”. As can be seen in the graph below, on July 16th at HE 20 when RT OZP was the highest, 775 MW of HDR resources were scheduled. For five of the nine hours, the entire HDR bid was scheduled.
Similar to last week’s review, there were no negative day-ahead or real-time prices. There were several hours where the real-time Ontario price moved from well below the day-ahead price to real-time spikes significantly above it. Also to be noted is that the weekly average day-ahead price was about $17/MWh higher than the average real-time price.
OR Prices
Both real-time and day-ahead Operating Reserve (OR) prices remain elevated compared to historical averages. The average weekly day-ahead 10S price was $12.13/MW, while it was $13.71/MW in real-time. Again, this highlights that the supply stack in the OR market remains much tighter in the renewed market compared to the legacy market (as noted in previous commentaries). In conjunction with higher real-time OZPs, higher OR prices are also observed.
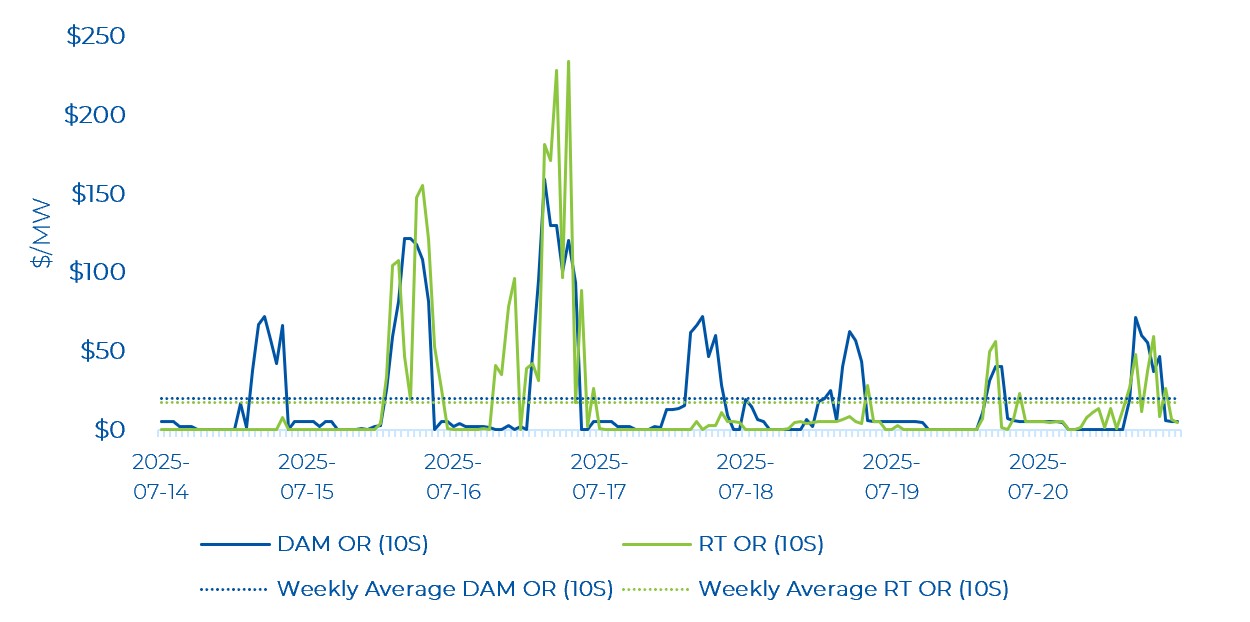
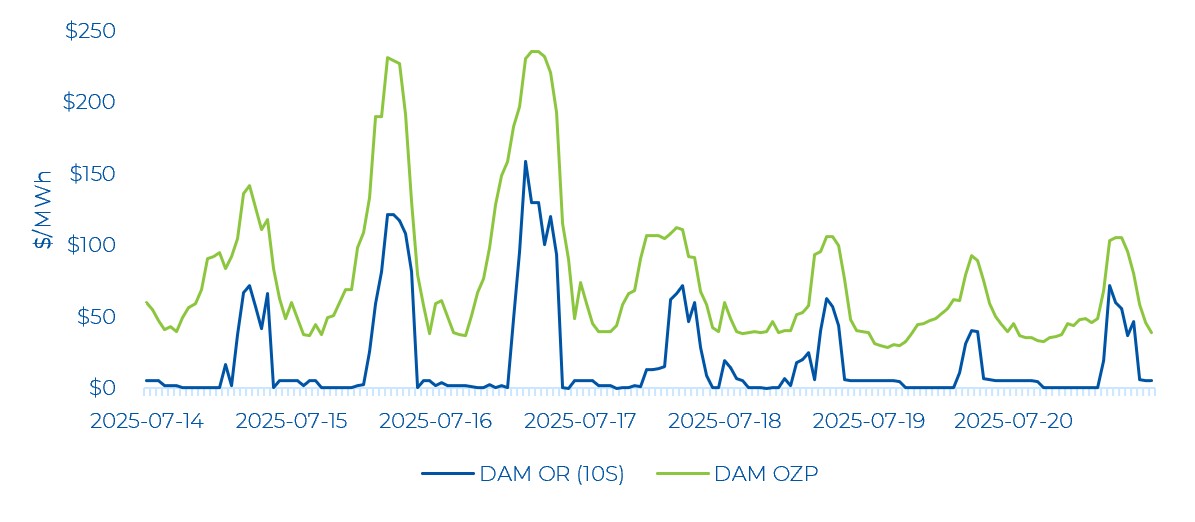
The average hourly OR price was below the average hourly energy price in the day-ahead market for all hours of the week – in line with historical patterns. Day-ahead OR prices closely tracked energy prices.
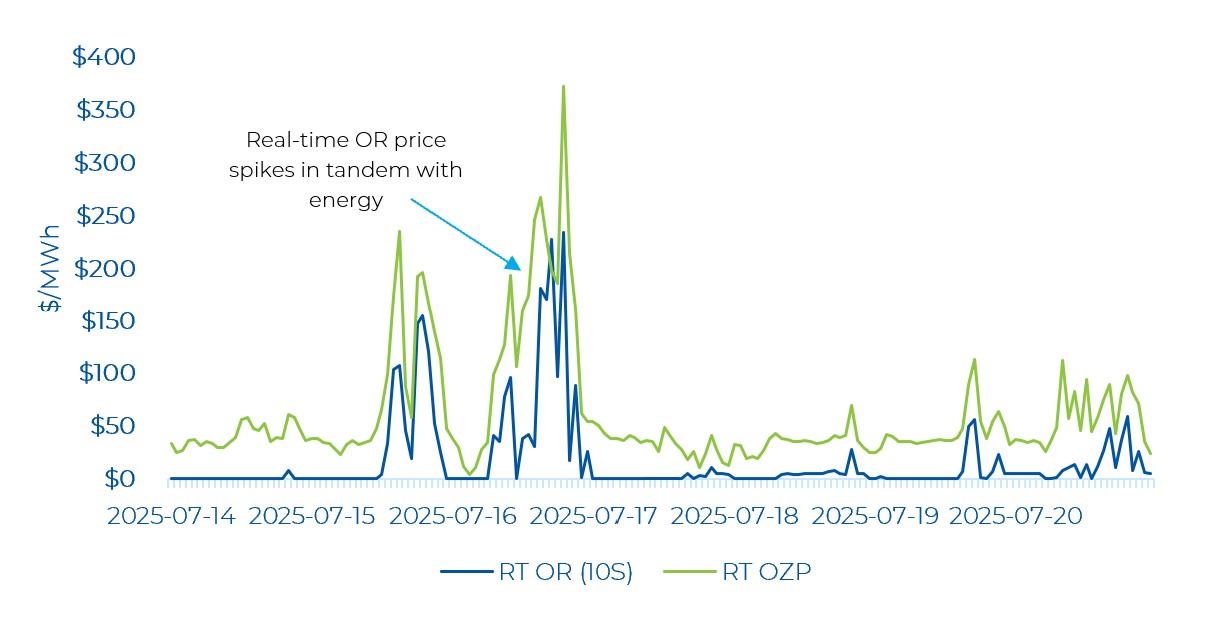
Real-time OR prices were low for several hours of the week with OR prices exhibiting less volatility compared to energy prices. Real-time OR prices are moving in tandem with real-time OZP. Note that real-time prices continue to have much less convergence just like the previous week’s review.
Zonal Prices and Congestion
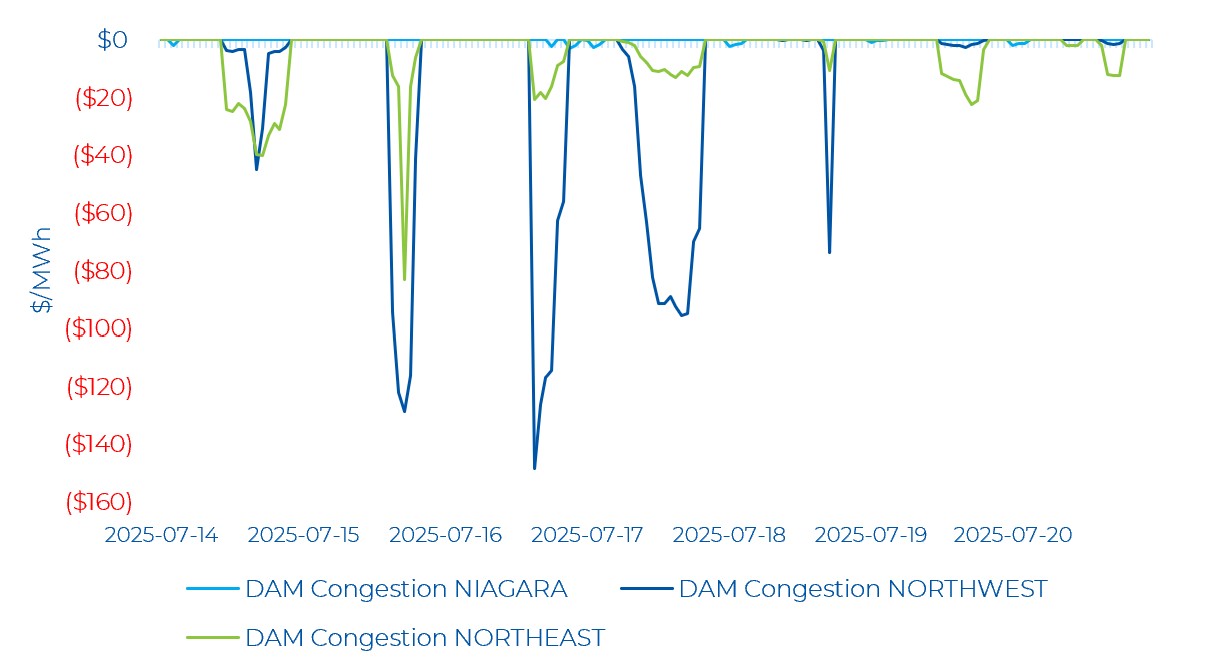
Last week, the Northwest and Northeast zones experienced the most congestion during the day-ahead timeframe. Congestion in the Niagara zone was minor. Most of the negative congestion in the Northwest zone persisted for several hours across multiple days of the week, while the Northeast zone saw less negative congestion. The Northwest zone saw the most negative congestion on July 16 and the Northeast zone saw the most negative congestion on July 15 – both of these days had the highest demand for the week.
Note that negative congestion typically means there was a constraint exporting energy from a particular zone, while positive congestion is the opposite. The Northwest and Northeast zones typically post negative congestion in the day-ahead market, as there is often more supply than demand and limited transmission to export it to the major load centres in southern Ontario.
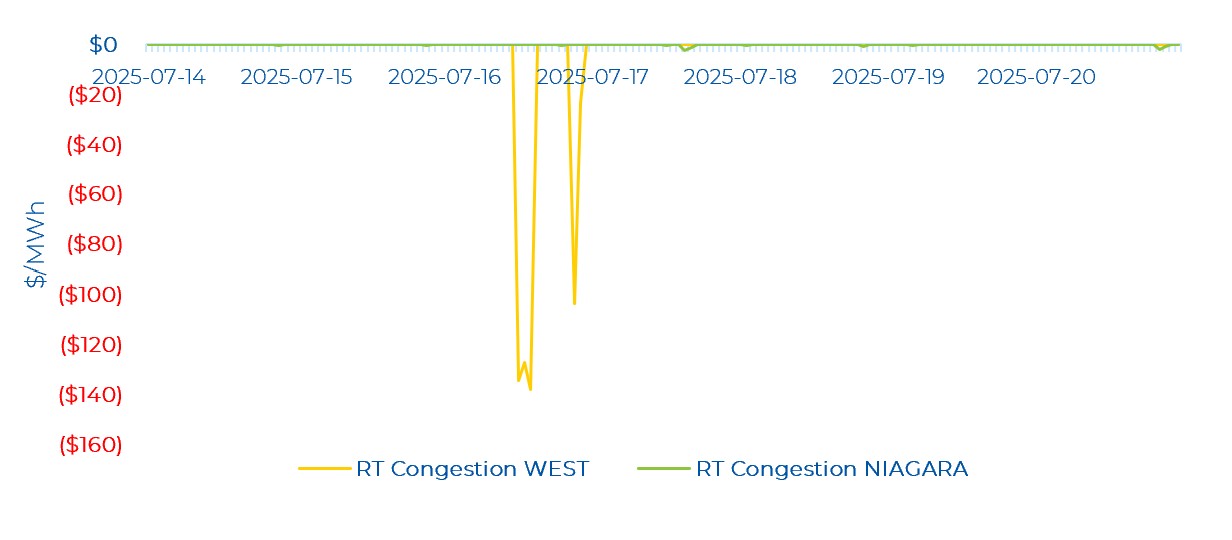
Real-time zonal prices in the Northwest and Northeast remain volatile. The Northwest zone saw both negative and positive congestion. The moderate positive congestion was in the early morning of July 15 while very negative congestion was observed throughout the whole week. The Northeast zone only saw negative congestion.
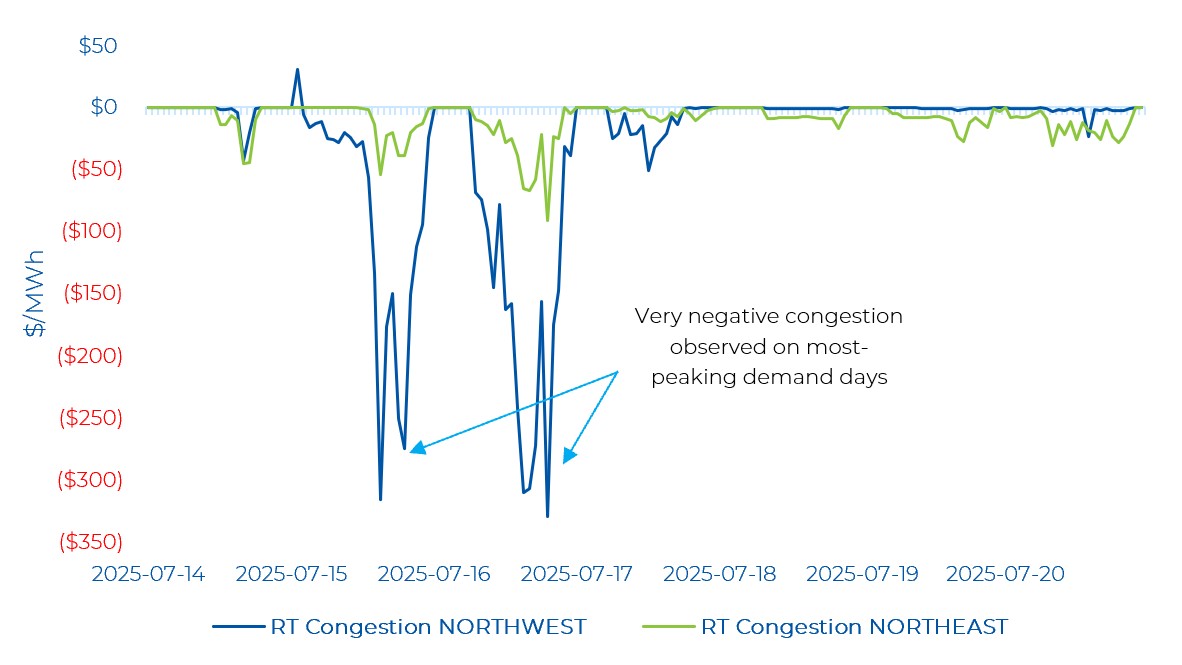
And in real-time, the West zone saw very negative congestion on the peak-demand day of the week –whereas there was no congestion in the day-ahead market for the same hours. The most negative congestion was observed on July 16, reaching -$137.86/MWh. The Niagara zone saw very minor negative congestion.