Note: Real time hourly data is not available in the IESO public reports for October 24, HE 17 and has been excluded from the commentary and figures.
Day-Ahead and Real-Time Price Trends by Components and by Zone
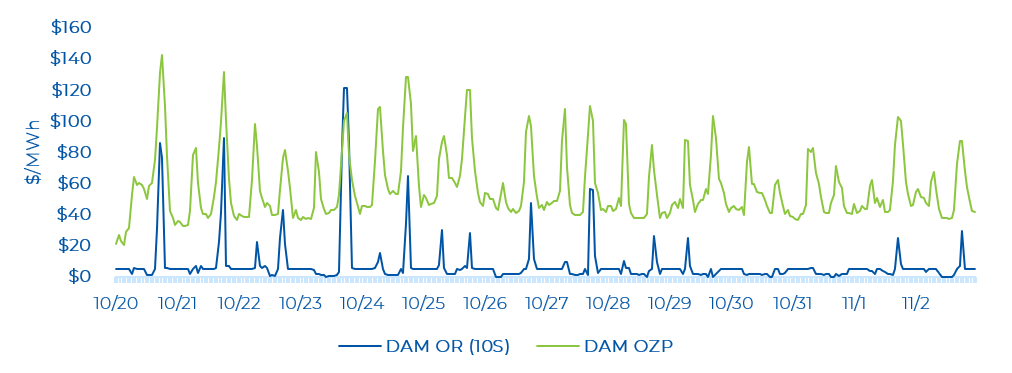
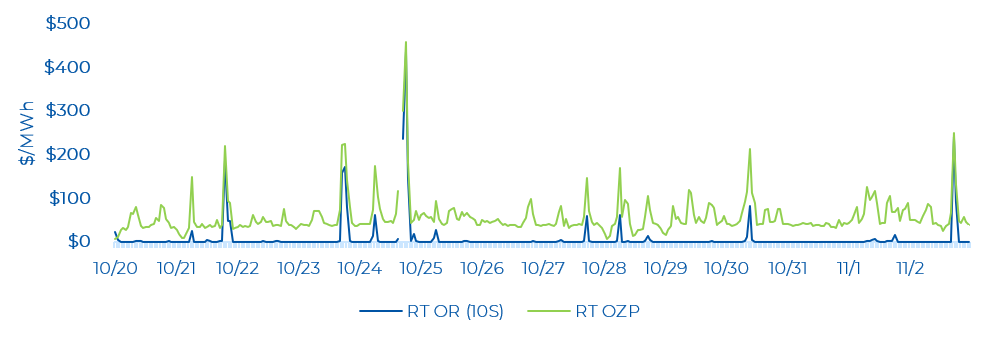
The last two weeks saw Day-Ahead (DA) prices move higher and Real-Time (RT) zonal prices move lower compared to the previous two weeks. Average DA zonal prices ranged from $50/MWh (Niagara) to $69/MWh (Northwest), while RT zonal prices ranged between $52/MWh (Niagara) to $63/MWh (Northwest). Similar to the previous review, the Northwest zone was the highest priced zone across the IESO-Administered Market (IAM) – highlighting the unique congestion conditions facing that zone where prices were much lower compared to other zones throughout the summer, but has recently been the highest-priced zone.
The DA and RT price by zone and by component for the past two weeks is shown below.

Day-Ahead and Real-Time Prices
The average hourly day-ahead OZP was $57.04/MWh over the two weeks, while the real-time OZP was $56.74/MWh – marking one of the closest DA-to-RT spreads under the renewed market. There were 7 real-time hourly OZP spikes greater than $200/MWh – with most of these price spikes coming in the evening hours when demand is changing rapidly. The highest real-time OZP was $457.66/MWh (on October 24, HE 19). The real-time OZP of the previous hour was also high at $300.41/MWh, reflecting the tight supply conditions leading to a price spike. The peak Ontario Demand over the last two weeks was 17,854 MW (on October 30, HE 17). Ontario demand on October 24, HE 19 – when OZP hit its highest level – was 17,006 MW.

OR Prices
There were few real-time Operating Reserve (OR) price spikes in the last two weeks. The average weekly day-ahead 10S price was $7.62/MW, while it was $7.18/MW in real-time – with OR prices appearing to moderate compared to OR prices in the first few months of the renewed market. The highest OR price spike of $435.66/MWh was coincident with the highest real-time OZP spike. As noted throughout our commentaries, OR prices remain elevated compared to prices in the legacy market, but have moderated recently.
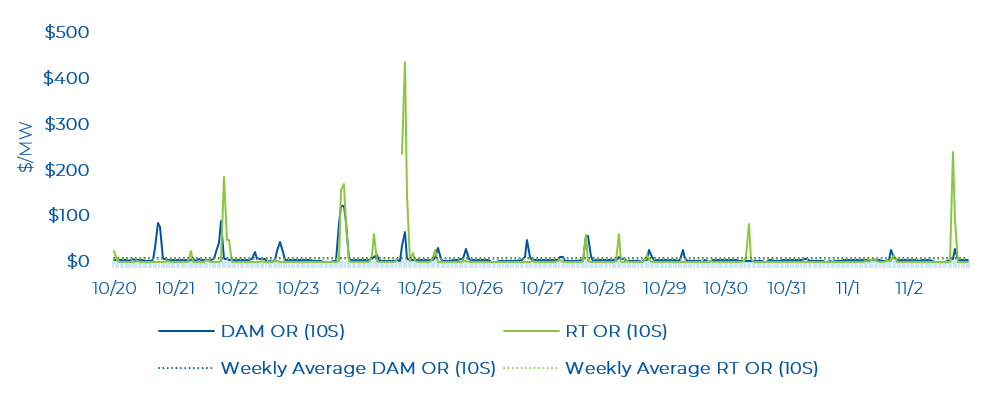
The highest day-ahead OR price was $121.61/MWh, which occurred on October 23, HE 18. The day-ahead energy price was $99.97/MWh at this time.
Real-time OR prices were low (i.e., near $0.20/MWh) for many hours. There were several real-time OR price spikes throughout the last two weeks, coincident with real time OZP spikes. The highest real-time OR price was $435.66/MWh on October 24, HE 19.
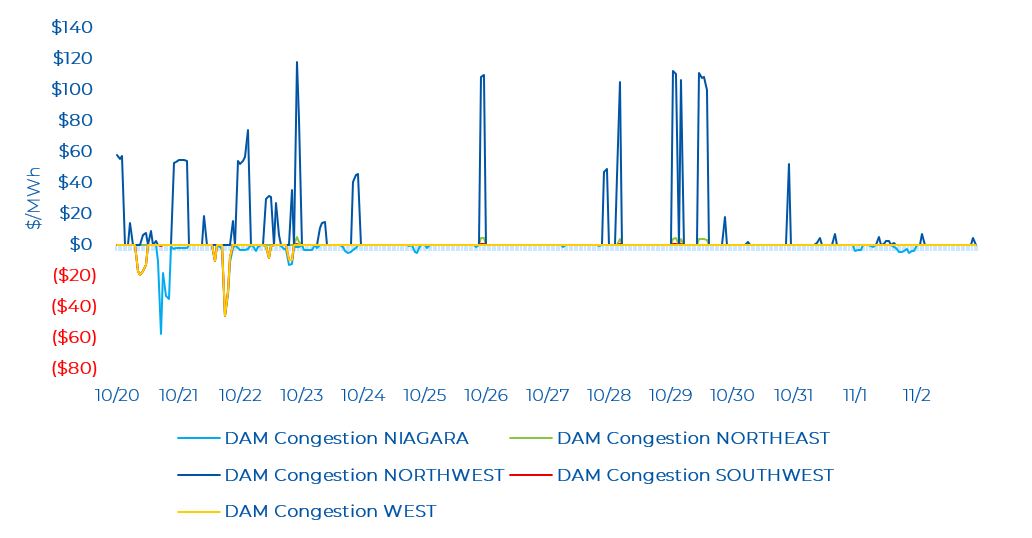
Zonal Prices and Congestion
For the last two weeks, the Northwest zone experienced the most congestion in the day-ahead time frame. The Northwest zone was highly congested throughout the week, with several congested hours above $50/MWh with a high of $118.05/MWh (on October 22, HE 23). Mainly negative congestion was observed in the Niagara, Southwest, and West zones. These zones saw the greatest magnitude of congestion early on in the first of the last two weeks. The Niagara, Southwest, and West zones saw lows of -$57.43/MWh, -$45.60/MWh, and -$46.03/MWh respectively. The congestion observed in the Southwest and West zones were almost identical. The Northeast zone experienced some minor positive congestion.
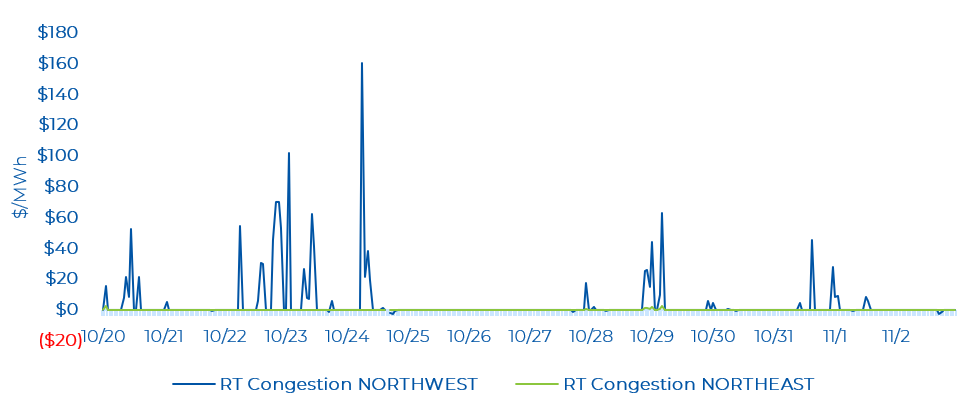
Real-time zonal prices in the Northwest zone remain volatile – with the Northwest seeing frequent hours of positive congestion. The Northwest saw a high of $160.59/MWh (on October 24, HE 7). Congestion may have been more pronounced due to continuous outages across these Northwest-zone connected interfaces: East-West Transfer East (EWTE)/East-West Transfer West (EWTW). On the other hand, the Northeast zone saw minor positive congestion.
In real time, the Niagara, Southwest, and West zones observed a coincident low of congestion on October 21, HE 20. The three zones saw a low of about -$77/MWh to $89/MWh. At this hour, there was an outage/limit on the St. Lawrence West interface (which is connected to New York via the West zone). From the previous hour, imports from New York increased by 174 MW and from Michigan increased by 118 MW. Exports to New York also increased by 375 MW. The outage on the transmission interface, additional imports and exports via the intertie, as well as peaking demand close to this hour (reflecting tight supply conditions), may have contributed towards the coincident negative congestion across these zones. Note, that these zones are all neighbouring to one another (with the Southwest in the middle of the other two). The Toronto zone also saw minor congestion. Another point to note is that there have been multiple outages/limits almost every hour across major interfaces (ETWE, EWTE, FIO) in the past four weeks. If this pattern of outages continues (in addition to the increased exports to Quebec or to the U.S.), we are likely to see more congestion across several zones.
