On July 24, 2025, the IESO issued a “Market Tool Outage” advisory notice. The notice stated that starting on July 24 at 17:40 EST to July 24 at 19:39 EST, “Automated electronic dispatch instructions sent via Dispatch Service will be unavailable. The IESO will manually dispatch by phone as required. Dispatch Service Web User Interface users will need to login and verify connected after the outage.” Hence, hourly real-time and interval-level data is missing at HE 19 and between HE 18 to HE 20 respectively and impacts the figures included in this review.
Blocked Dispatches by the IESO Increased in June (Dispatch Deviation Report)
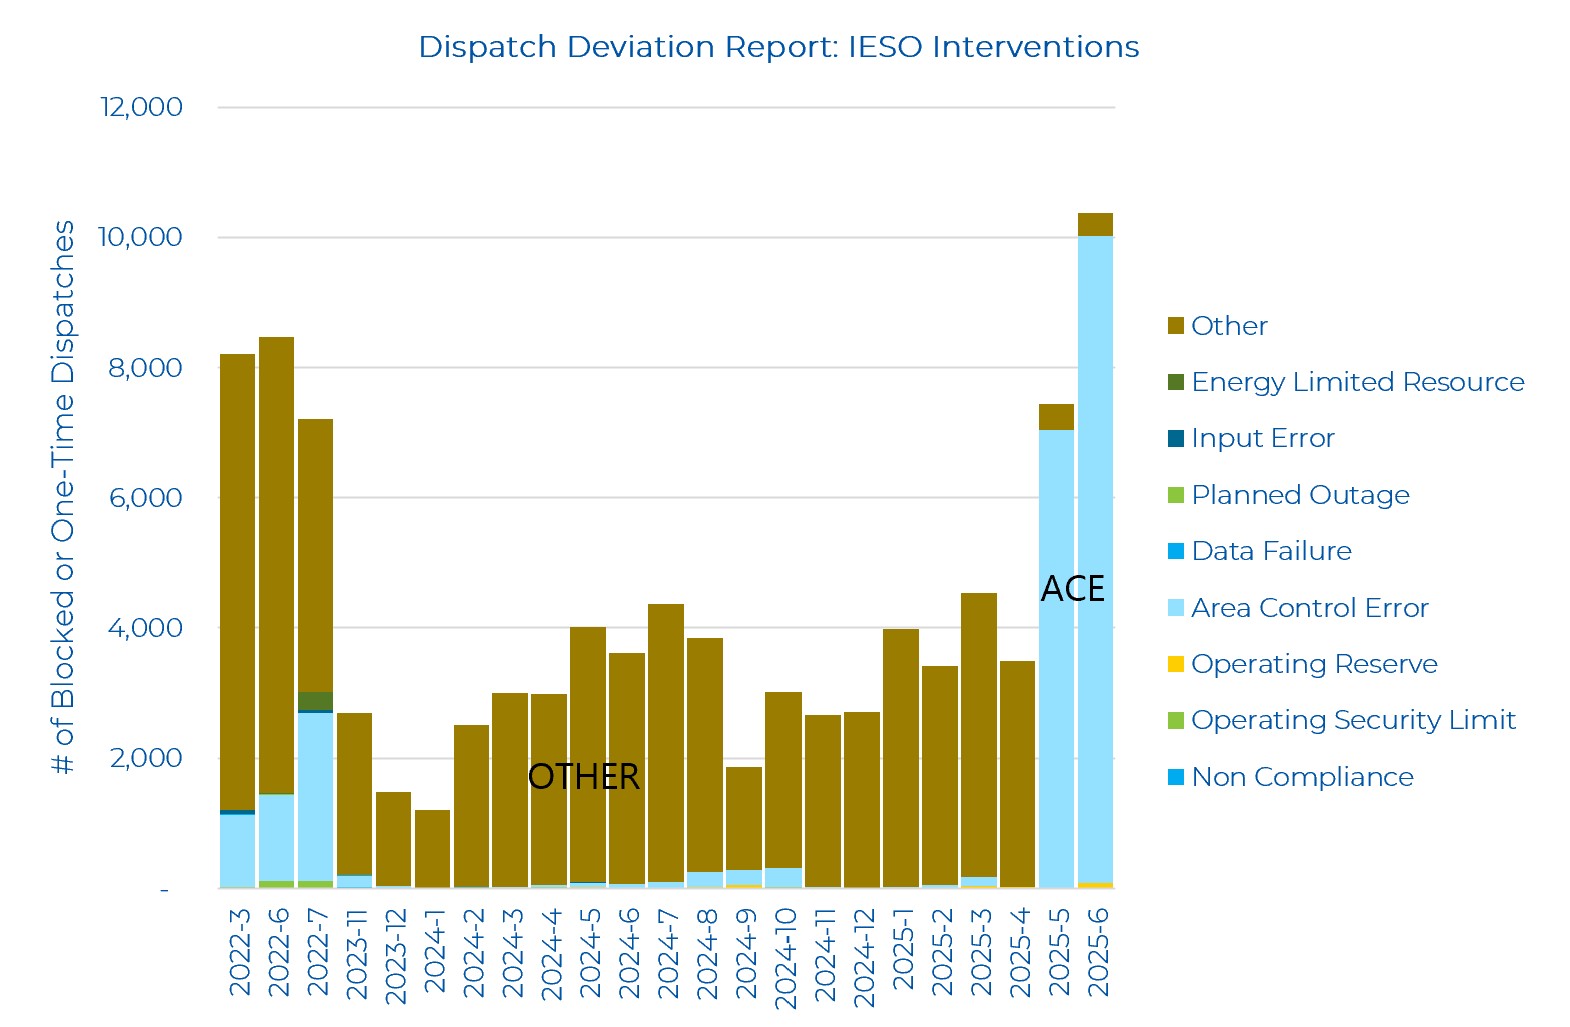
The IESO has published the Dispatch Deviation Report for June 2025, which indicates the highest number of monthly market interventions by the IESO since March 2022 (no reports are published prior to this date). According to the IESO, "this report summarizes the number of occurrences where the IESO has deviated significantly from the results of the dispatch algorithm". The IESO has improved its reporting for the reasoning of blocked or one-time dispatches since MRP went live, relying less on the “Other” category. The “Other” category is defined as follows: “the action was taken for reasons not listed above, or where multiple rationale are applicable”. Area Control Error is the leading cause of blocked dispatches, which is an action taken by the IESO to correct an over or under generation condition. An example of a blocked dispatch would be the IESO control room telling Market Participants not to follow dispatch instructions for a specific interval or intervals. The data for all available dispatch deviation reporting from the IESO is shown below, with the list of IESO rationale categories included in the legend.
Day-Ahead and Real-Time Prices
Based on interval-level real-time Market Demand and Ontario Zonal Price (OZP) data published by the IESO since the launch of the MRP to July 27, 2025, Power Advisory has highlighted the last week’s trend of Market Demand and OZP below. Note that only interval data published by the IESO is shown, missing entries (~1%) are not represented.
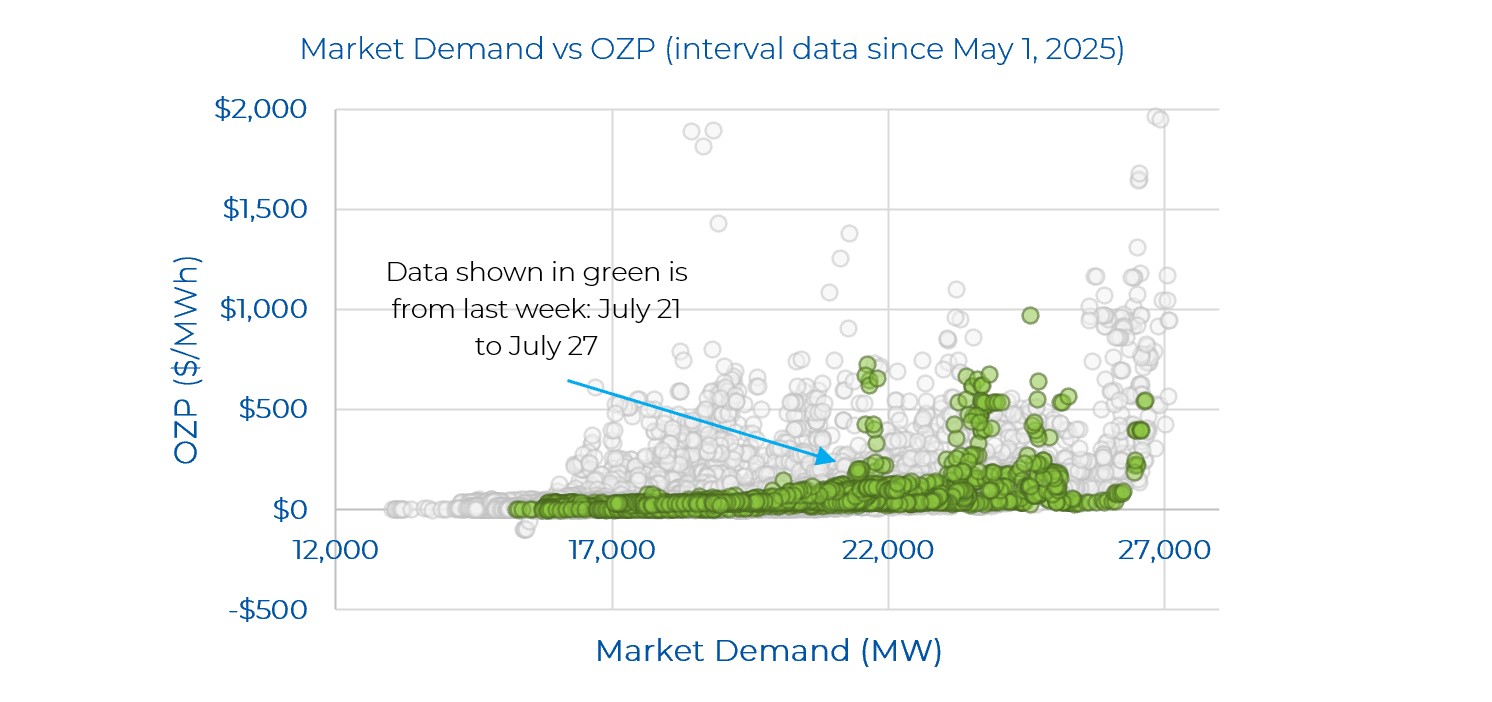
Considering all interval level data since May 1, the highest real-time OZP spike remains at $1,961.23/MWh during one of the hottest demand days, June 24, where Market Demand was 26,837MW and Ontario Demand was 24,409MW during a heat wave. Most prices are well below $200/MWh. Last week, on July 25 on hour 19 at the 6th interval, the OZP reached a high of $969.18/MWh for the week. The Market Demand was 24,572 MW during that interval.
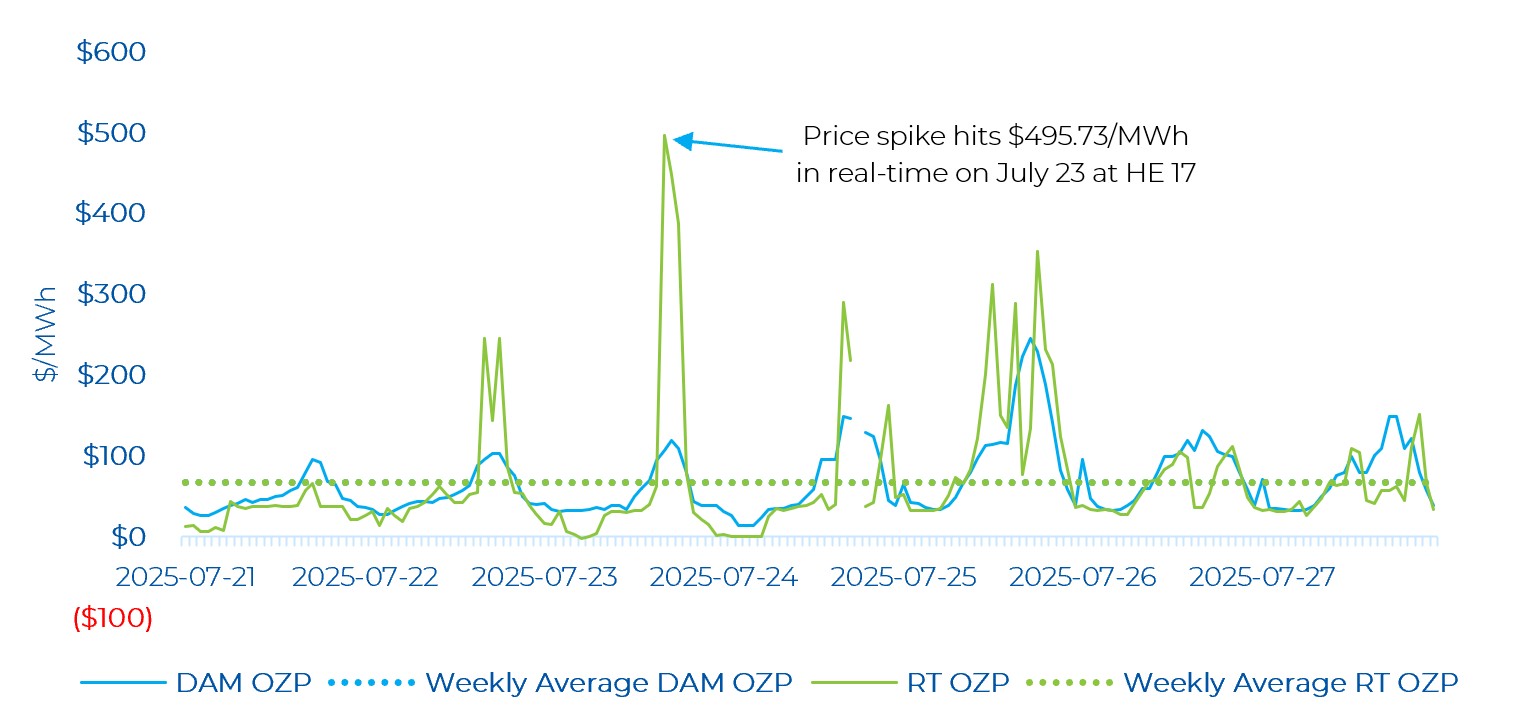
Looking at last week’s day-ahead and real-time prices, real-time energy prices were very volatile, but there was better convergence between the day-ahead and real-time energy prices compared to last week’s review. There were 13 real-time OZP spikes greater than $200/MWh, with the highest price hitting $495.73/MWh (on July 23). Although demand was relatively high that day, the peak Ontario Demand last week was 24,521 MW (on July 24, HE 18) right before the market tool outage occurred. It’s likely that the high price spike hour was due to changing demand as demand increased by about 860 MW from the previous hour. The price spikes observed throughout the last week occurred in mainly the evening hours where demand is changing quickly. Note the break in the data in the figure is due to missing data from the Market Tool Outage as highlighted at the top of this review.
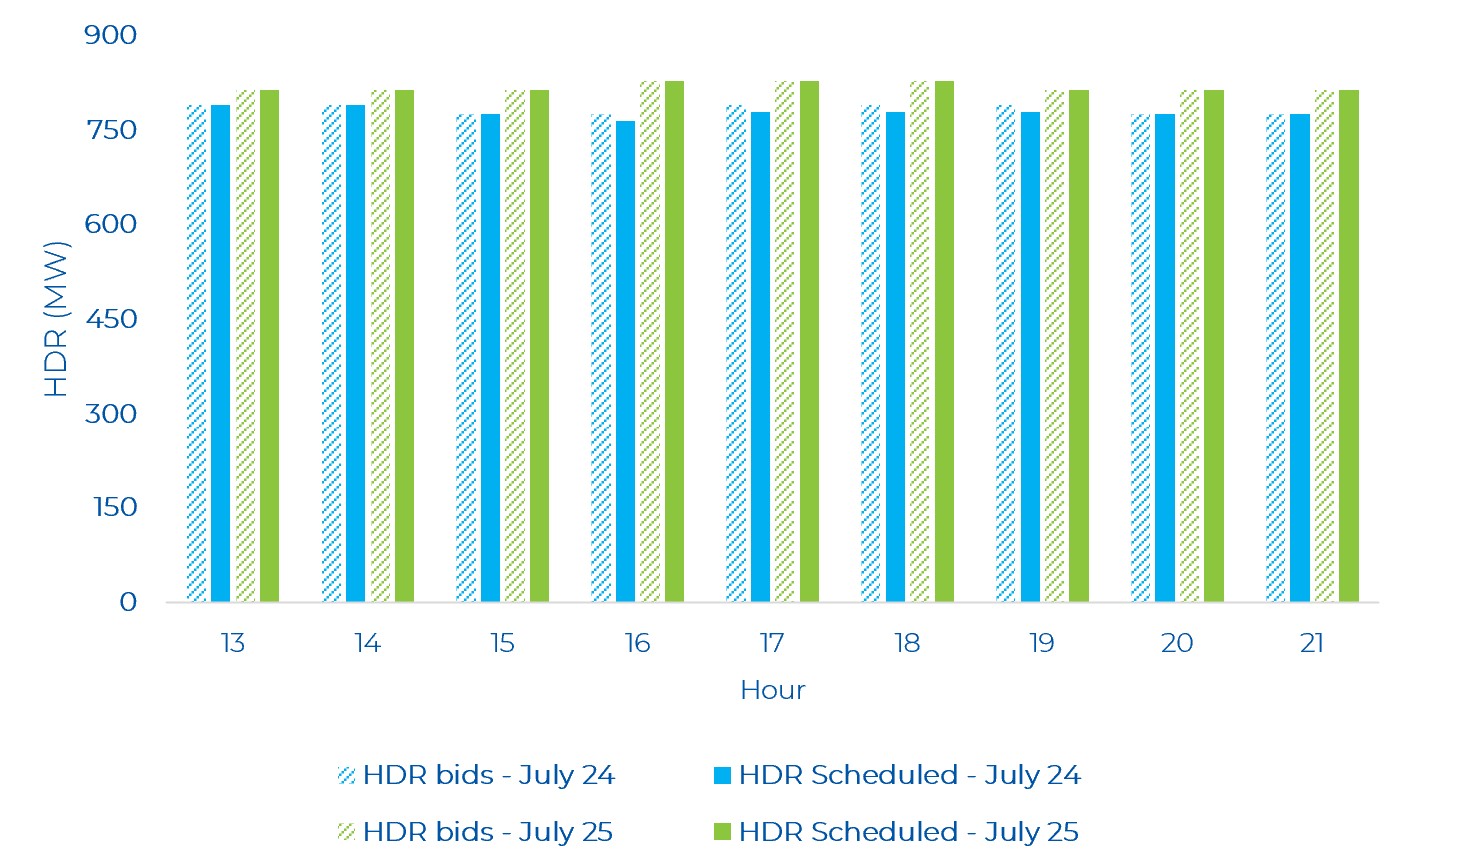
Last week, there were several hours where hourly demand response (HDR) resources were “scheduled on”, i.e. how much of the load got scheduled. As can be seen in the graph below, on high demand days like July 24 and July 25 for all HE 13 to HE 21 hours, almost all or nearly all of the HDR bid ended up scheduled. This reflects high demand and/or tight supply conditions leading to the high real-time price peaks observed on these days.
Similar to last week’s review, there were no negative day-ahead prices. There was only one negative real-time price in the very early morning of July 23. There were several hours where the real-time Ontario price moved from well below the day-ahead price to real-time spikes significantly above it. Also to be noted is that the weekly average day-ahead price was nearly identical to the average real-time price, with the average day-ahead price being about $0.33/MWh higher than the average real-time price. The week priors’ difference was much higher at about $17/MWh. The closer spreads between the average prices are reflecting a greater convergence between the day-ahead and real-time market, even as price volatility continues on an hourly basis.
OR Prices
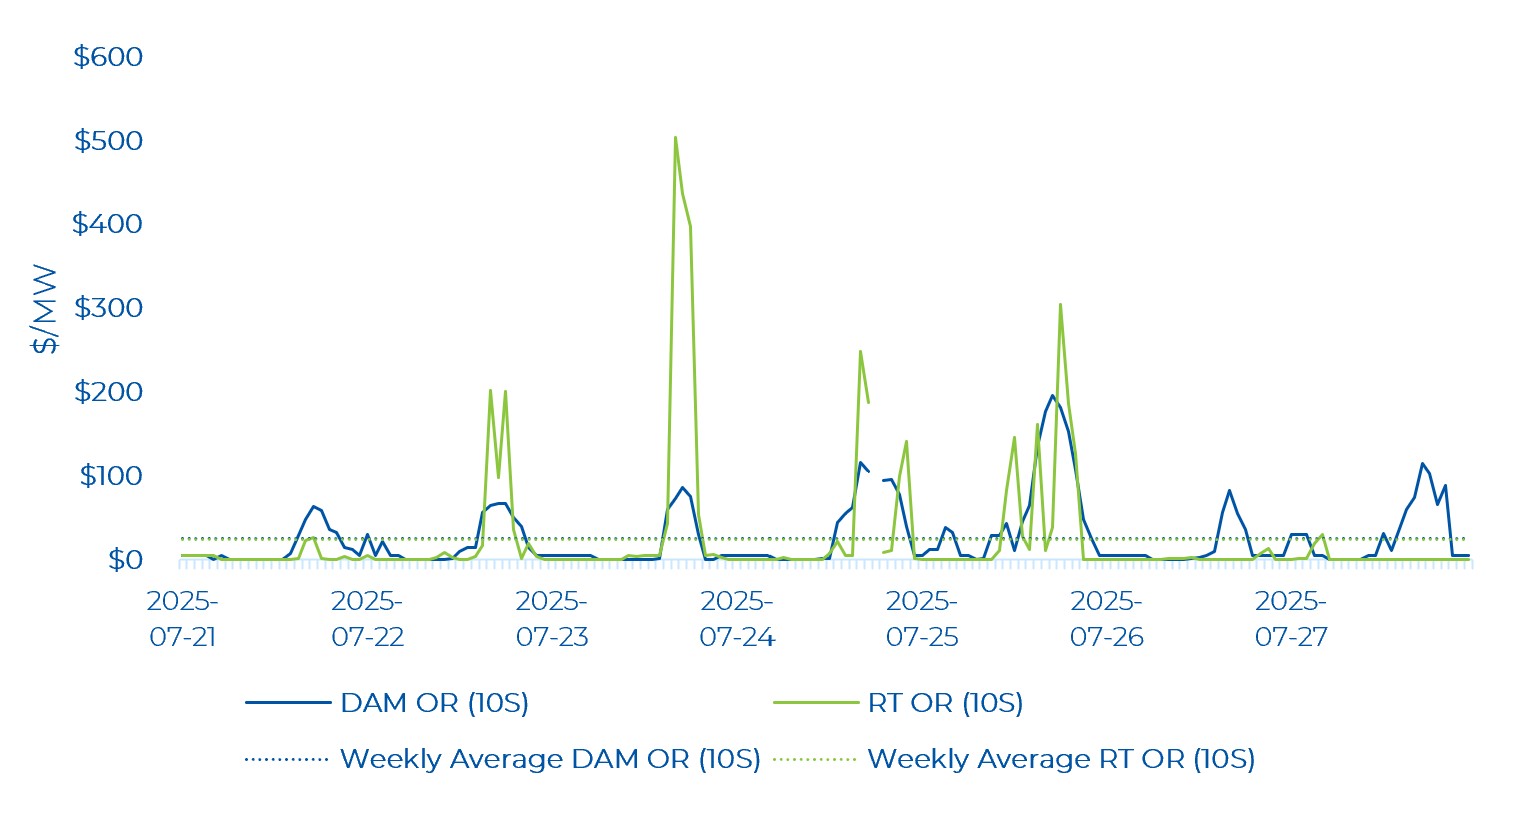
Both real-time and day-ahead Operating Reserve (OR) prices remain elevated compared to historical averages. The average weekly day-ahead 10S price was $25.52/MW, while it was $24.38/MW in real-time. Again, this highlights that the supply stack in the OR market remains much tighter in the renewed market compared to the legacy market (as noted in previous commentaries). In conjunction with higher real-time OZPs, higher OR prices are also observed.
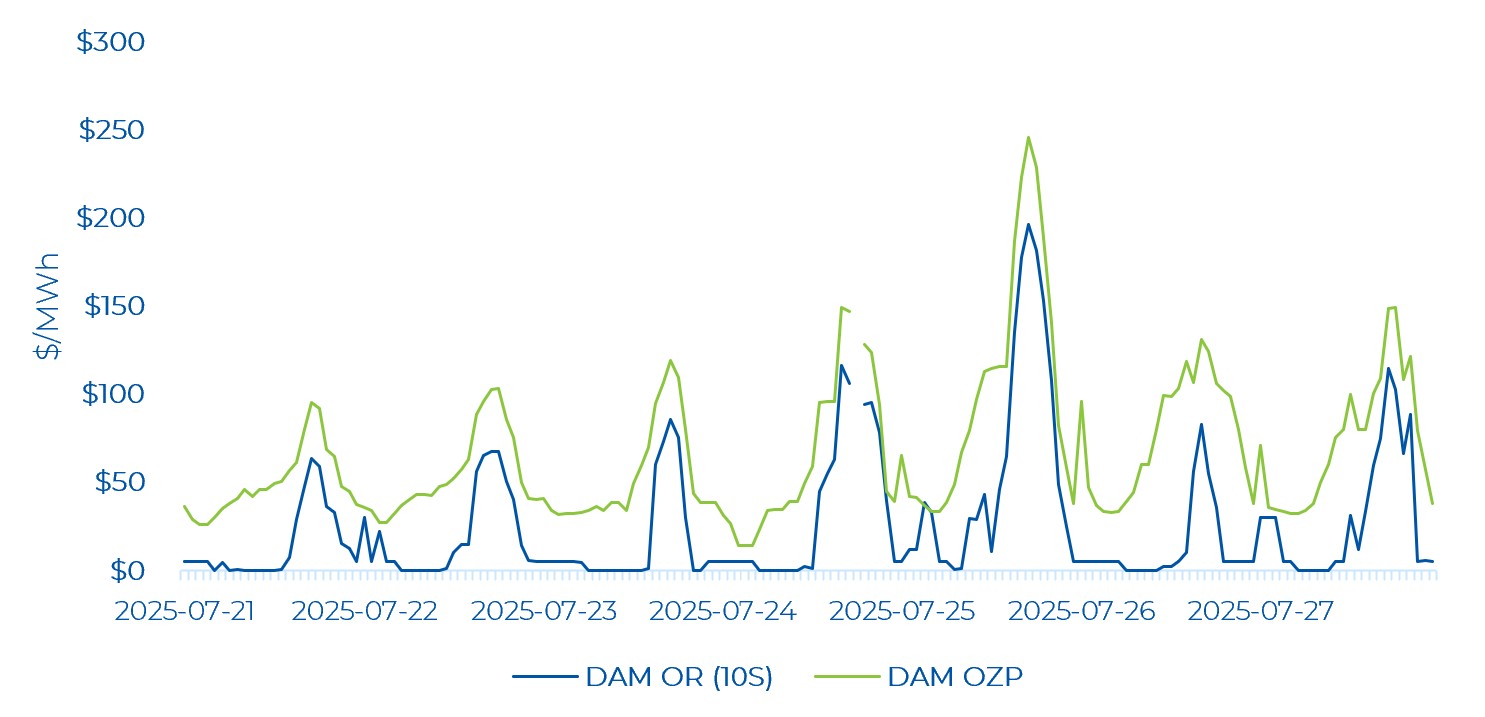
The average Day-ahead market prices for OR and energy remained in line with historical patterns, with the average hourly DAM OR price below the average hourly DAM energy price for all hours of the week. Day-ahead OR prices closely tracked the trend in energy prices. The highest day-ahead OR price was $196.23/MWh, which occurred at the same time as the day-ahead price peak of $245.55/MWh.
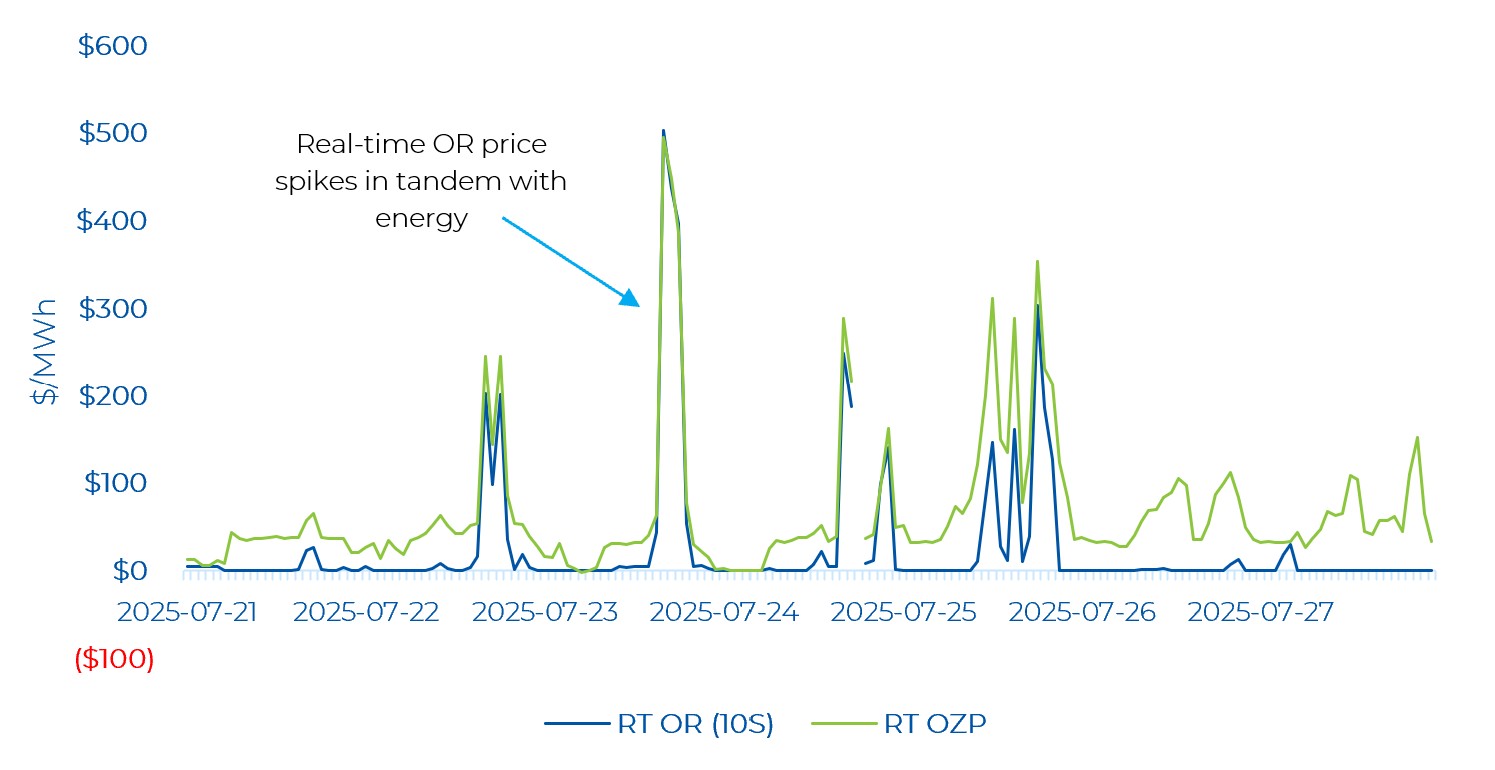
Real-time OR prices were low (i.e., near $0/MWh) for several hours of the week with OR prices exhibiting less volatility compared to energy prices. Real-time OR prices are moving in tandem with real-time OZP. Real-time OR prices reached $503.46/MWh, which occurred at the same time as the real-time price peak of $495.73/MWh.
Zonal Prices and Congestion
Last week, during the day-ahead timeframe, the Northwest and Northeast zones experienced the most congestion. Congestion in the Niagara zone was minor. Most of the negative congestion in the Northwest and Northeast zone occurred on July 24– the highest demand day of last week. The Northwest zone saw the most negative congestion on July 24 HE 18 and the Northeast zone saw the most negative congestion on July 24 HE 17. Compared to the previous review, the congestion remained above -$100/MWh.
Note that negative congestion typically means there was a constraint exporting energy from a particular zone, while positive congestion is the opposite. The Northwest and Northeast zones typically post negative congestion in the day-ahead market, as there is often more supply than demand and limited transmission to export it to the major load centres in southern Ontario.

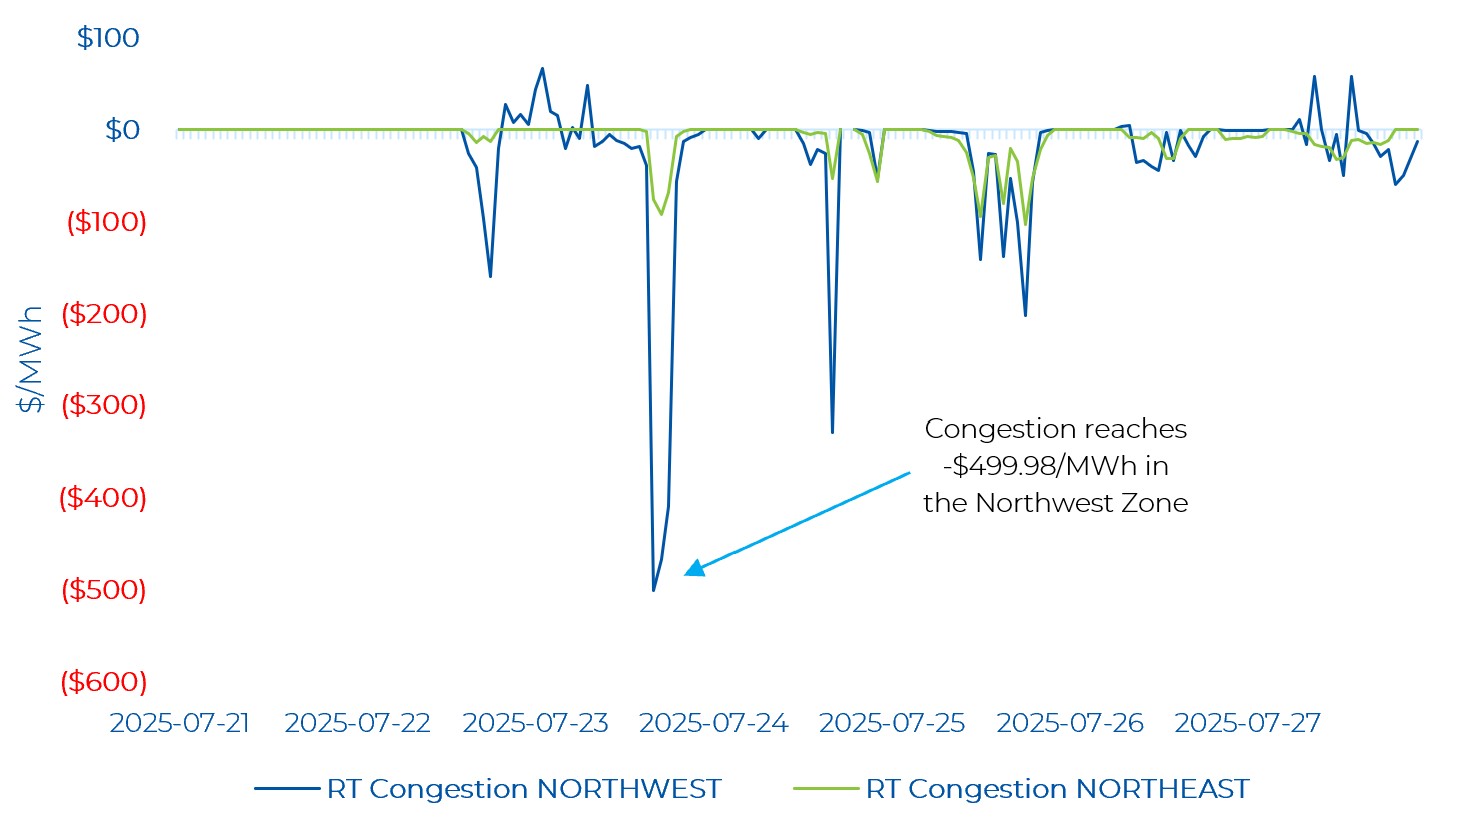
Real-time zonal prices in the Northwest and Northeast remain volatile. The Northwest zone saw both negative and positive congestion. The positive congestion occurred between the late night hours of July 22 to the early morning hours of July 23, and few hours of July 27 while very negative congestion was observed throughout the whole week. The Northeast zone only saw negative congestion. Coincident with the highest real-time OZP peak observed last week on July 23, the Northwest zone saw the most negative congestion reaching about -$500/MWh. Several hours of negative congestion was also observed in both zones on July 25.
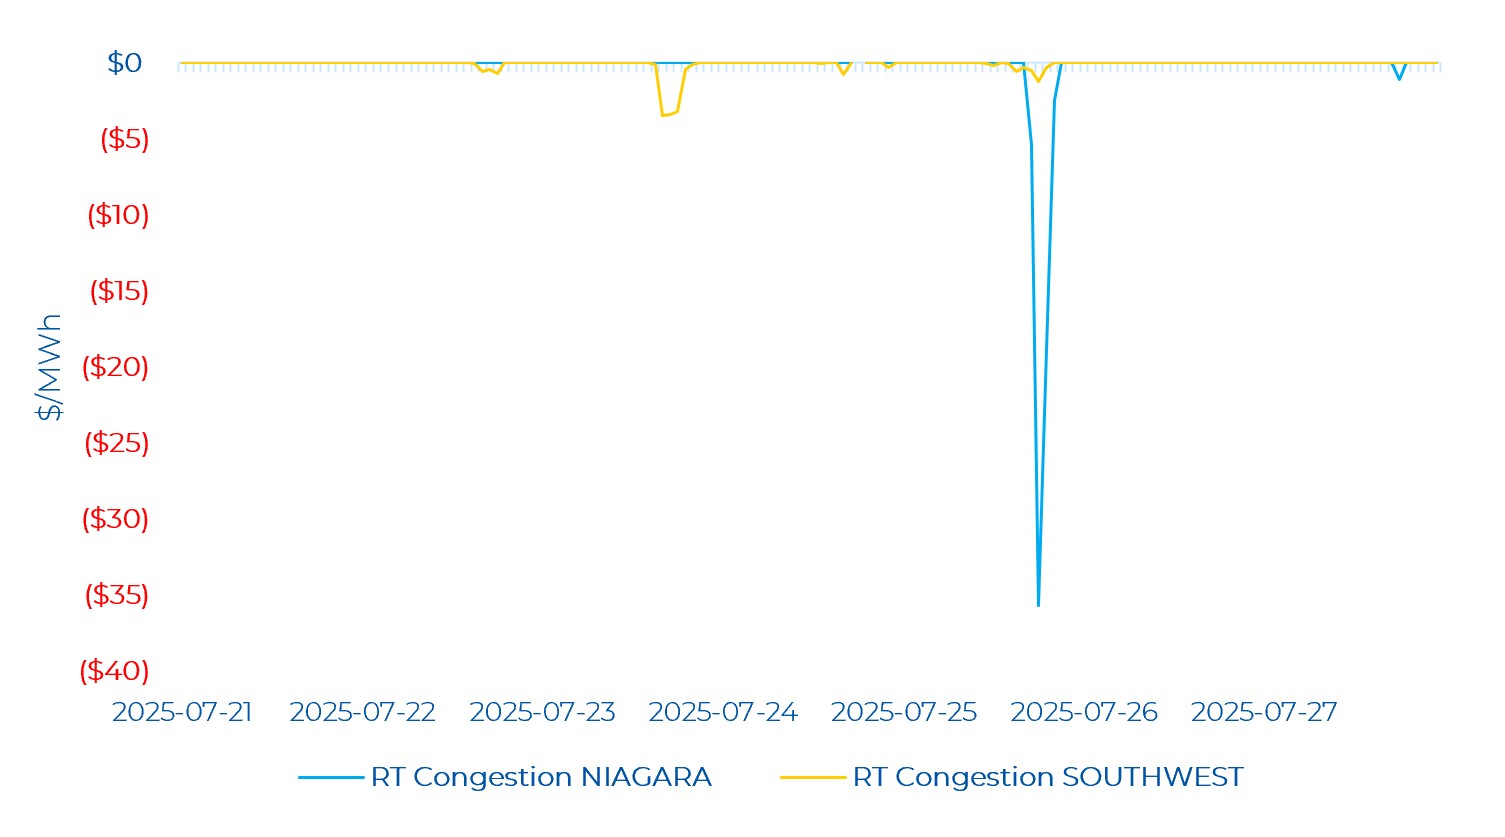
In the West zone last week, there was no congestion reported, in contrast with previous reviews where congestion was often being observed. The Niagara zone saw negative congestion on July 25 at HE 19. The congestion price reached a low of -$35.69/MWh. There was also minor congestion in the Southwest zone. The Southwest zone saw a low of -$3.41/MWh of congestion.