
• The market is in its sixth consecutive year of undersupply with prices near the ACP; federal and state policy, and to some extent, buyer/seller dynamics, will determine whether it stays that way
• CT and RI have made changes to their RPS in the past 12 months, and a third state, MA, is considering doing so; all of these are narrowing the undersupply gap
• Longer term, policy around offshore wind, solar and onshore wind remain the biggest question marks
The New England REC market is an important economic driver of renewable energy projects in the region. It is a market that can fluctuate significantly in price, because the ceiling price is $40/REC and the floor price is set by the voluntary market, which is currently trading at a meager $2-3/REC.
Policy decisions can have a dramatic – and sometimes abrupt – impact on these spot prices. While a single minor policy decision may have little to no impact on price in isolation, more significant changes – or multiple policy decisions across jurisdictions – can collectively tip the market into oversupply or undersupply, and drive price down or up, as the case may be.
Long-term pricing remains unclear, as several scenarios could play out, with the primary determining factors being federal and state policy around offshore wind, solar, and onshore wind, as well as policy around RPS and ACP schedules.
This article contains the following sections:
• Introduction to New England Class 1 RECs
• Supply and Demand
• Historical Pricing
• Recent state-level policy changes
• Massachusetts Clean Energy Standard (CES) will no longer impact the Class 1 REC market beginning in 2026
• Offshore Wind
• Long term supply-demand and market outlook
Introduction to New England Class 1 RECs
The New England Class 1 REC market is a collection of state-level RPS markets that share similar Class 1 definitions. "Class 1" refers to newer, cleaner renewable sources such as solar, wind, low-impact hydro, and biomass (including wood, though eligibility varies across states) and landfill gas; fuel cells are also eligible, in Connecticut and Maine only.
Each state has its own definition of what qualifies as Class 1, but these definitions largely overlap, making it possible for RECs to be traded across state lines within ISO-NE – effectively creating a regional market. As a result, projects can often sell their RECs into multiple New England RPS markets, depending on the eligibility criteria. Imports from adjacent control areas are also eligible to sell into ISO-NE, provided the power is delivered alongside the REC. Most notably, this includes off-contract wind from New York, and to a lesser extent, New Brunswick and Quebec, in Canada. In 2025, imports accounted for 19% of compliance.
The most liquid Class 1 REC markets are MA Class 1, CT Class 1, RI New Renewable Energy and NH Class 1 (Non-Thermal); these markets all trade as a group. When prices are high, ME also trades in line with this group, though slightly below. When prices are lower, ME tends to drop off even more because of their more generous allowance of biomass (ME is the only state to allow black liquor). Vermont's REC market is entirely separate from the others. Its Tier 1 category allows large-scale hydro and has been consistently oversupplied, so it trades at a separate and much lower price point than the other New England markets.
While the New England states have aggressive RPS targets, there have been significant obstacles to deploying Class 1 resources, including expensive siting, transmission constraints, and challenging contract terms and conditions. Even for contracted projects, the attrition rate has been high.
Supply and Demand
As shown in Figure 1, the price of ISO-New England Class 1 RECs is a function of supply and demand where:
• Supply = the eligible megawatts installed x capacity factor
• Demand = the retail electricity supply net of exempt load x the RPS requirement
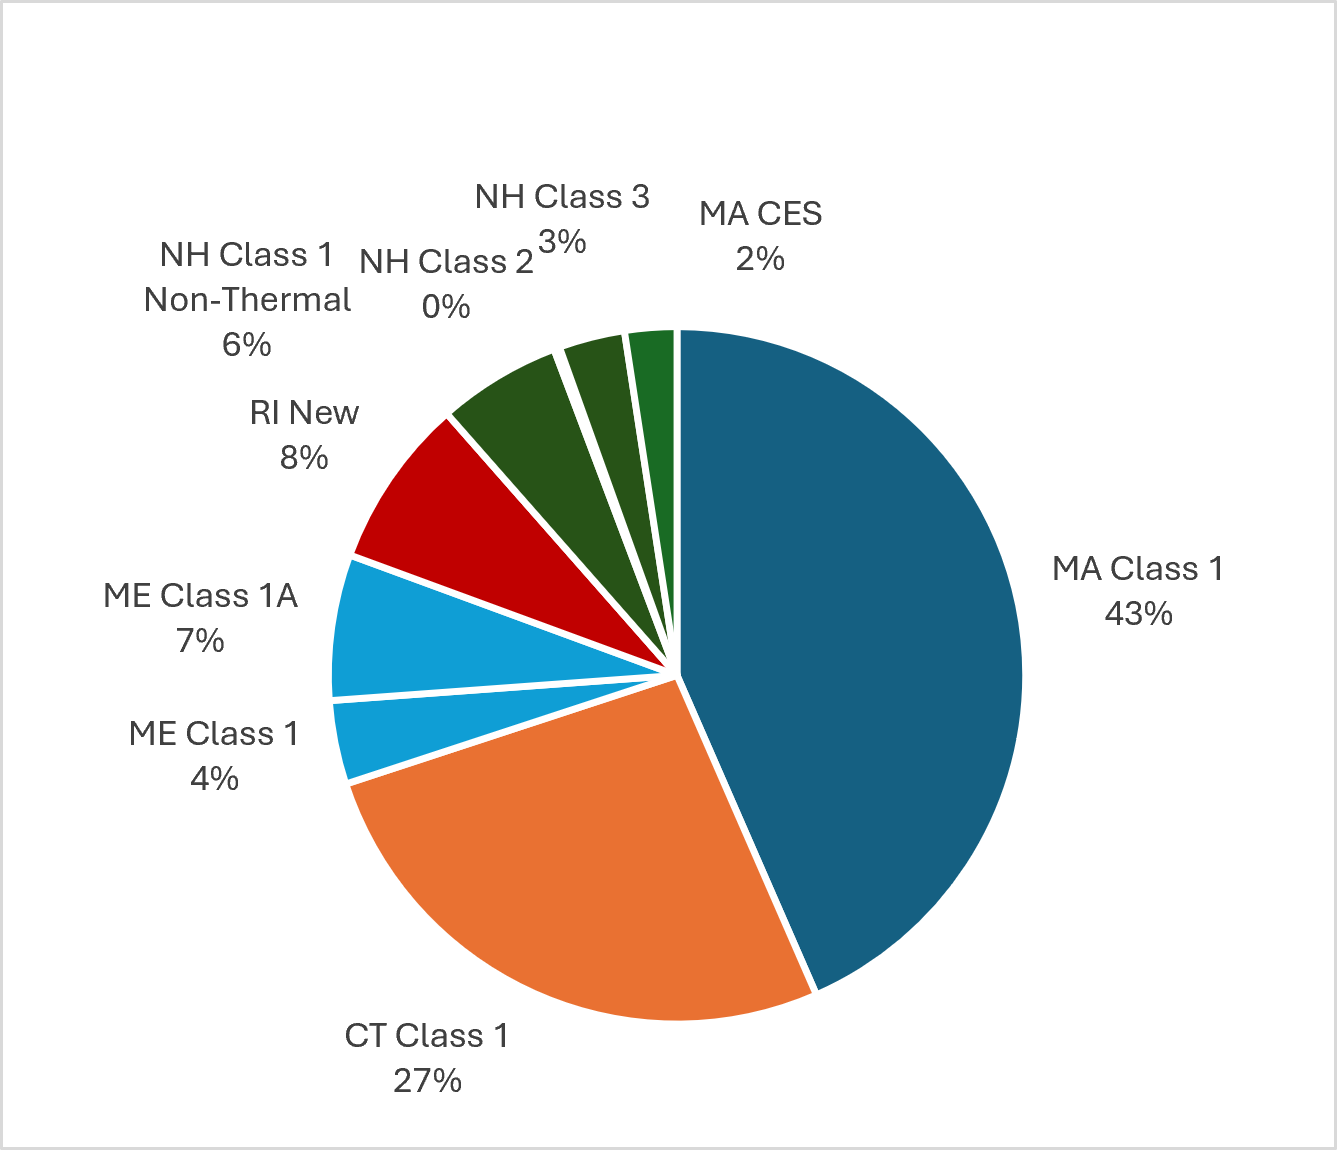
In 2025, supply was about 25 million RECs and demand was about 29 million RECs leading to an undersupplied market. Figure 2 shows a breakdown of settled RECs by fuel source while Figure 3 shows the generator location. Solar and wind accounted for 73% of settled RECs, while ME, MA, NY and CT accounted for 79% of settled RECs. On the demand side, Figure 4 shows the Class 1 Renewable Portfolio Standards (RPS) for each state. Based on these RPS requirements, Figure 5 shows that the regional demand totaled about 29 million RECs, with MA, CT, and ME accounting for 81% of the total.
Figure 1. 2025 Supply and Demand
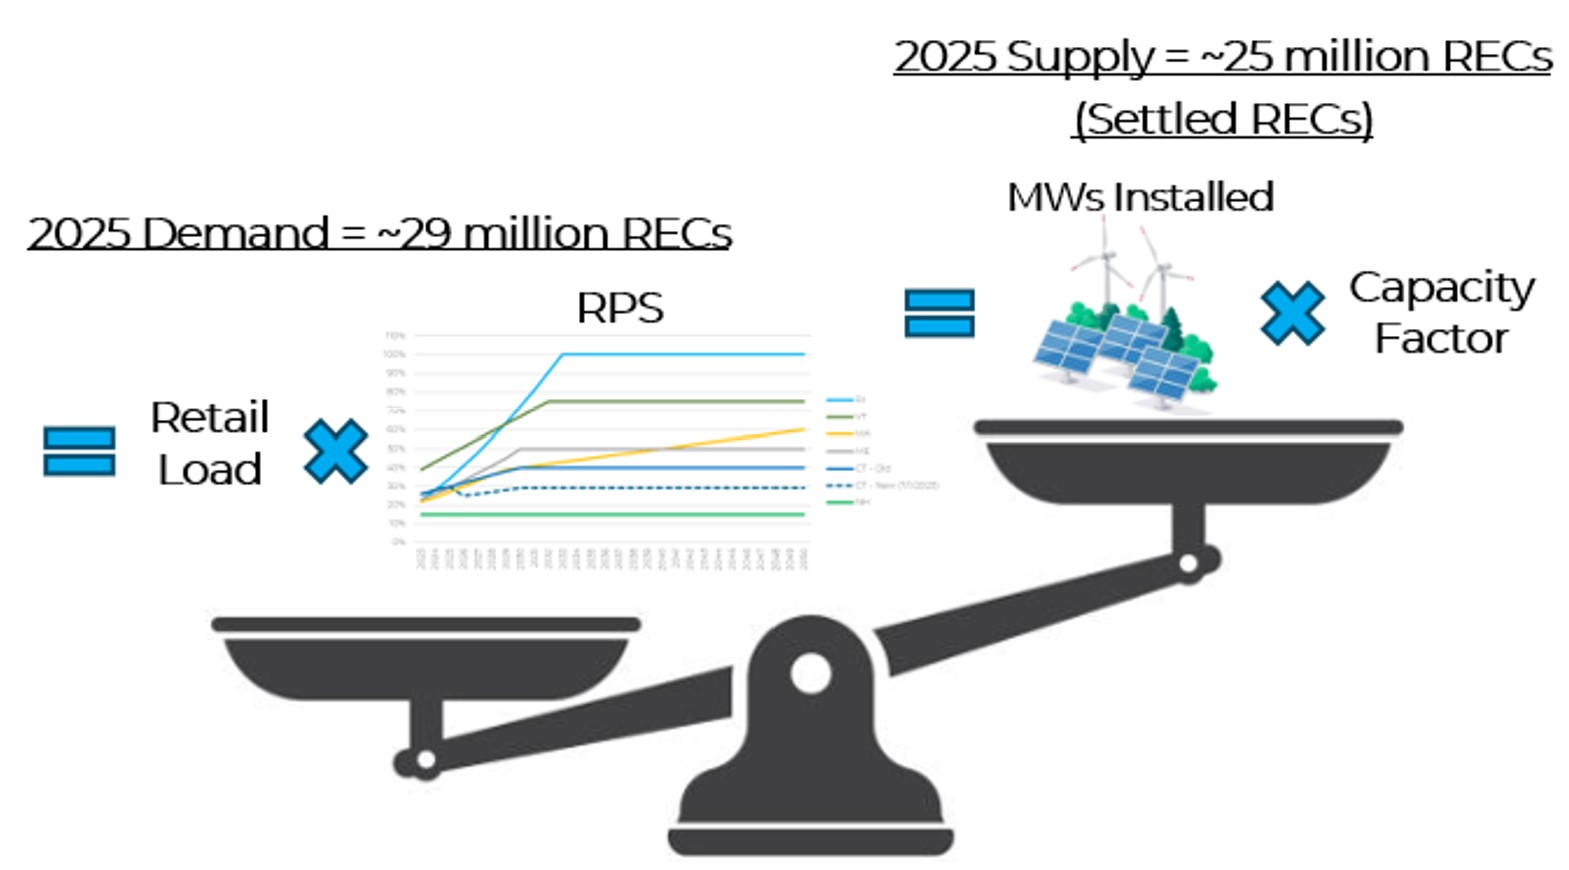
Figure 2. 2025 Settled RECs by Fuel Source, 24.6 million RECs
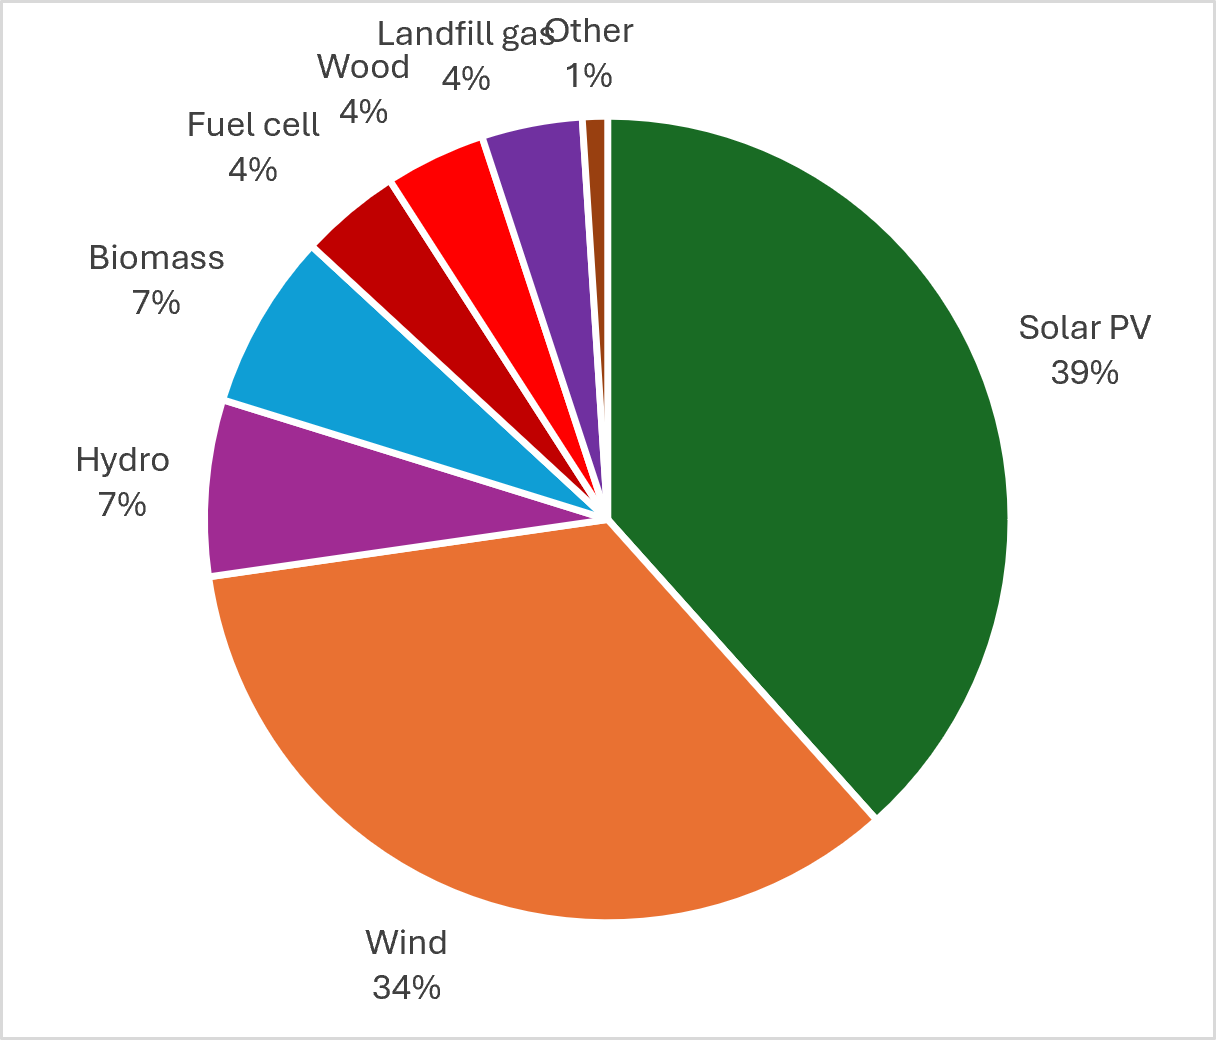
Note: NEPOOL GIS tracks biomass and wood separately, even though under most RPS definitions wood is considered under the umbrella of biomass. Thus, each generator facility is assigned as either a (non-wood) biomass facility or a wood facility
Figure 3. 2025 Settled RECs by Generator Location, 24.6 million RECs
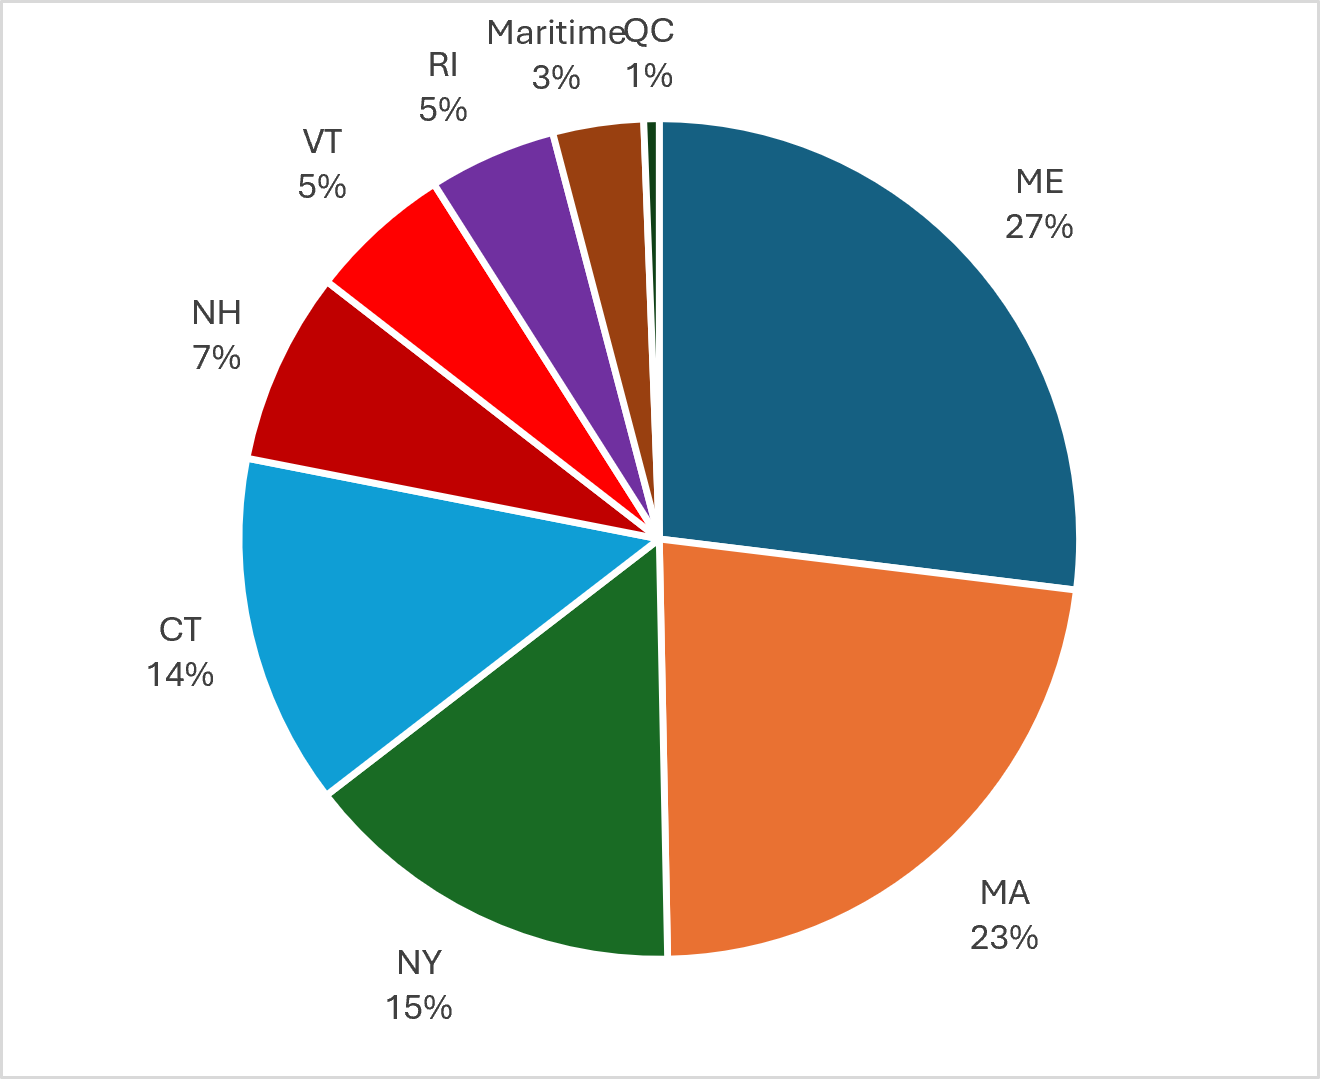
Figure 4. Class 1 RPS by State
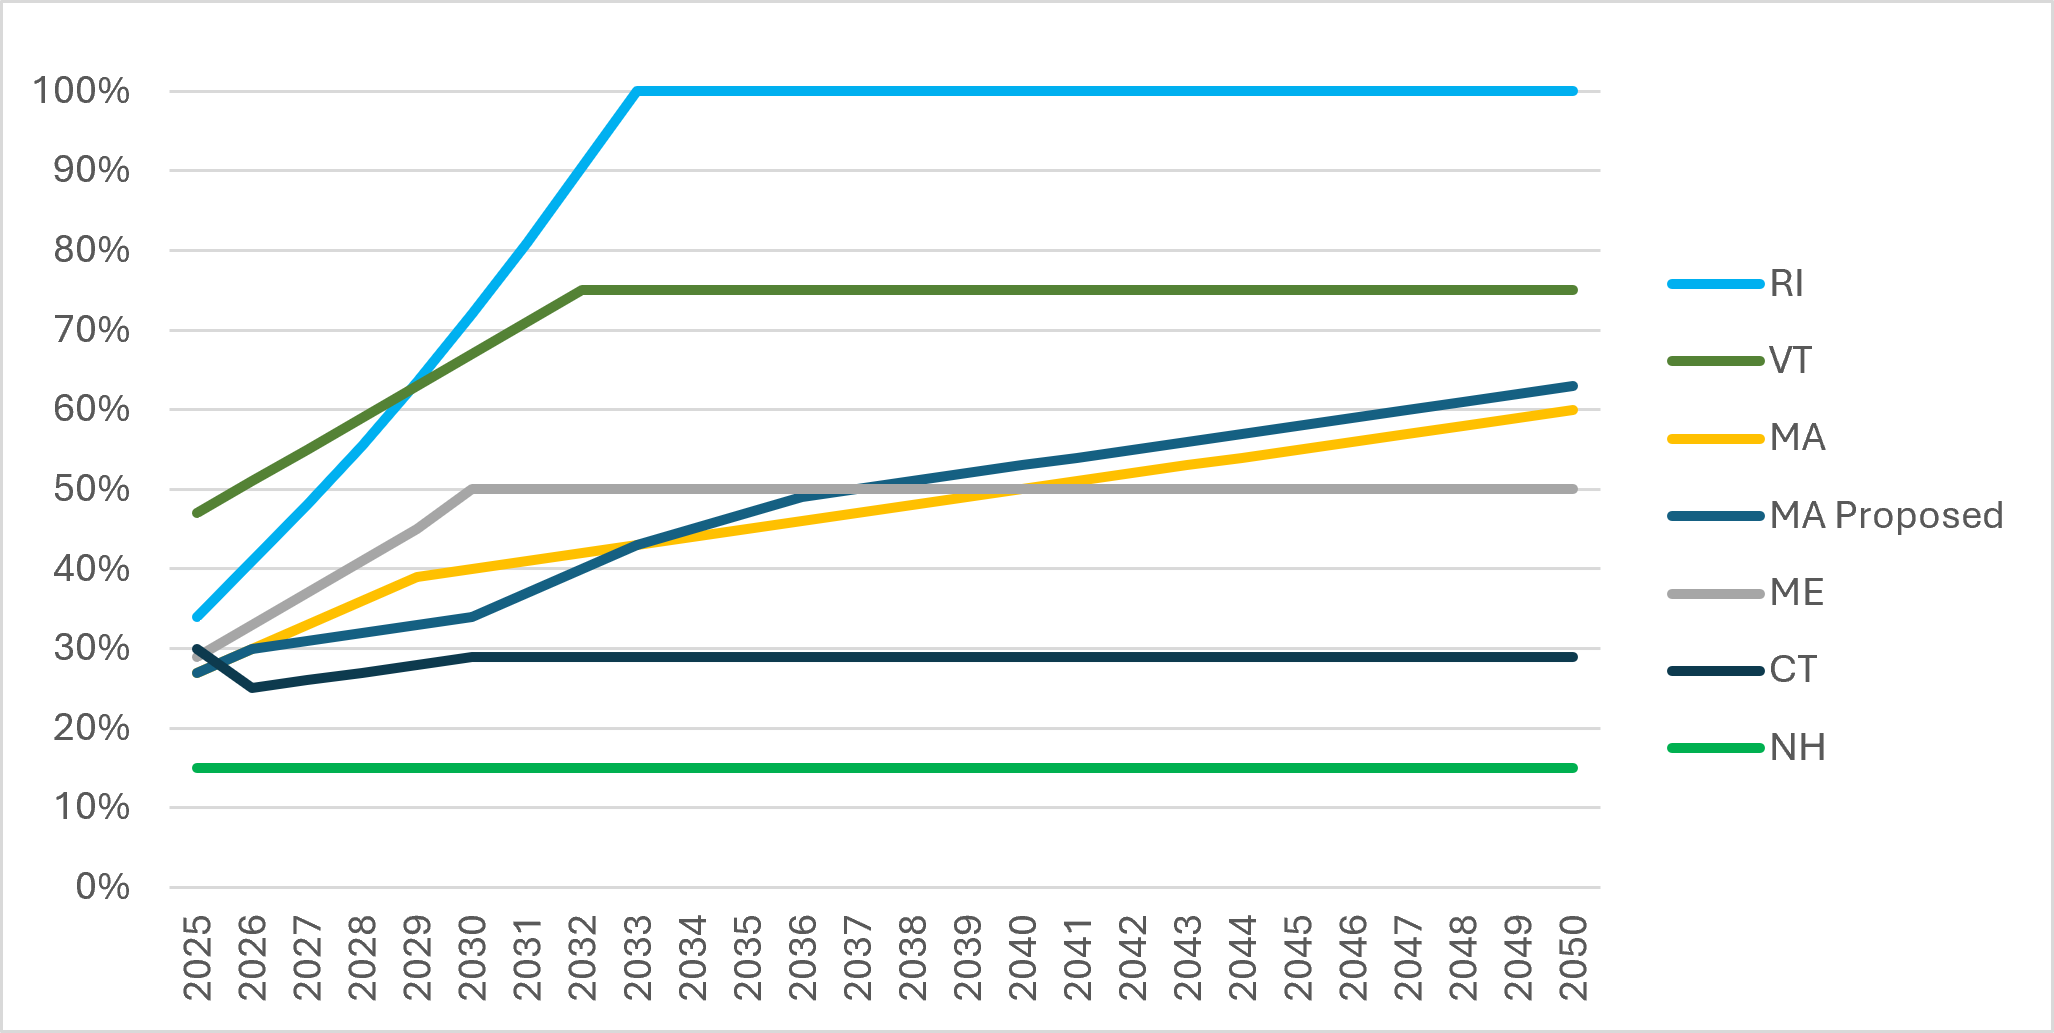
Figure 5. 2025 Compliance Obligation, 28.8 million RECs
An Alternative Compliance Payment (ACP) acts as a ceiling price (Figure 6). There are three states that have the same ACP of $40 – Massachusetts, Connecticut and Rhode Island. While Maine and New Hampshire have higher ACPs, the lowest ACP governs pricing as compliance entities will always seek to pay the lowest ACP. The reason is that competitive suppliers who have a presence in all five states, such as Constellation or EDF Energy Services, have the option of retiring RECs in the state with the highest ACP, and paying the ACP in the state(s) with the lowest ACP.
Figure 6. Alternative Compliance Payment by State ($/REC)
Historical Pricing
Figure 7 shows the REC pricing for the past 10 years along with 3 years of forward prices. ISO-NE Class 1 (MA/CT/RI/NH) prices have varied from $6 to almost $50 during this time. When the market is heavily oversupplied, prices fall, with the voluntary market acting as a floor. When the market is undersupplied, prices will gravitate toward the ACP. For going on 6 years, the market has been undersupplied, and price has been close to the ACP. Meanwhile, ME Class 1 has traded lower than the other markets owing to a broader definition of biomass than other states (it’s the only state where black liquor is an eligible resource) and allowing older projects that are refurbished or upgraded to sell into the market. According to Maine’s 2024 RPS Compliance Report, RECs from biomass facilities accounted for 72% of settled RECs for Maine Class 1.
Figure 7. New England REC Pricing, 2016-2029E ($/REC)
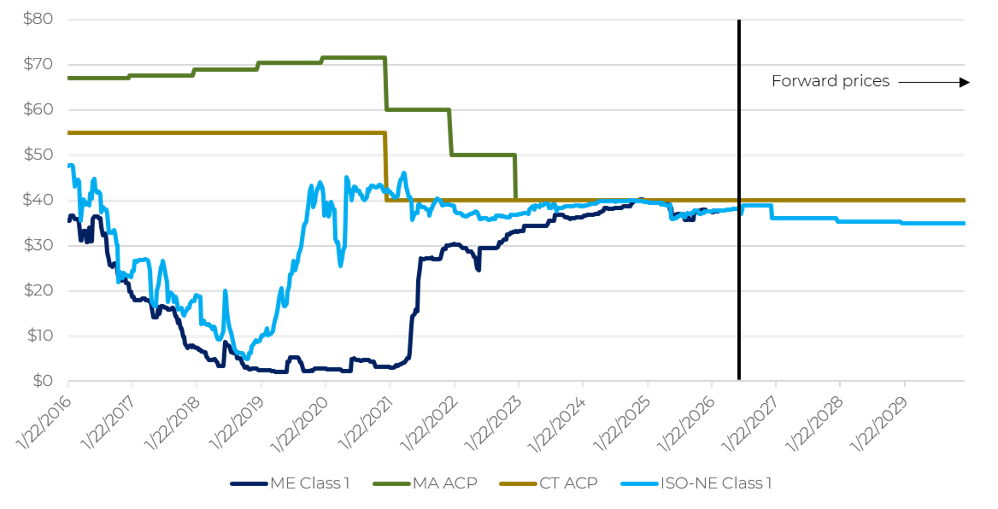
Note: Historical pricing for “ISO-NE Class 1” is a simple average of all vintages for MA Class 1, CT Class 1, RI New, and NH Class 1. Forward prices are from Marex Spectron (as of 8/13/2026).
This year marks the 6th year of a short market. Forward prices show mild erosion of prices to the low to mid $30s, which indicates a slight loosening of supply.
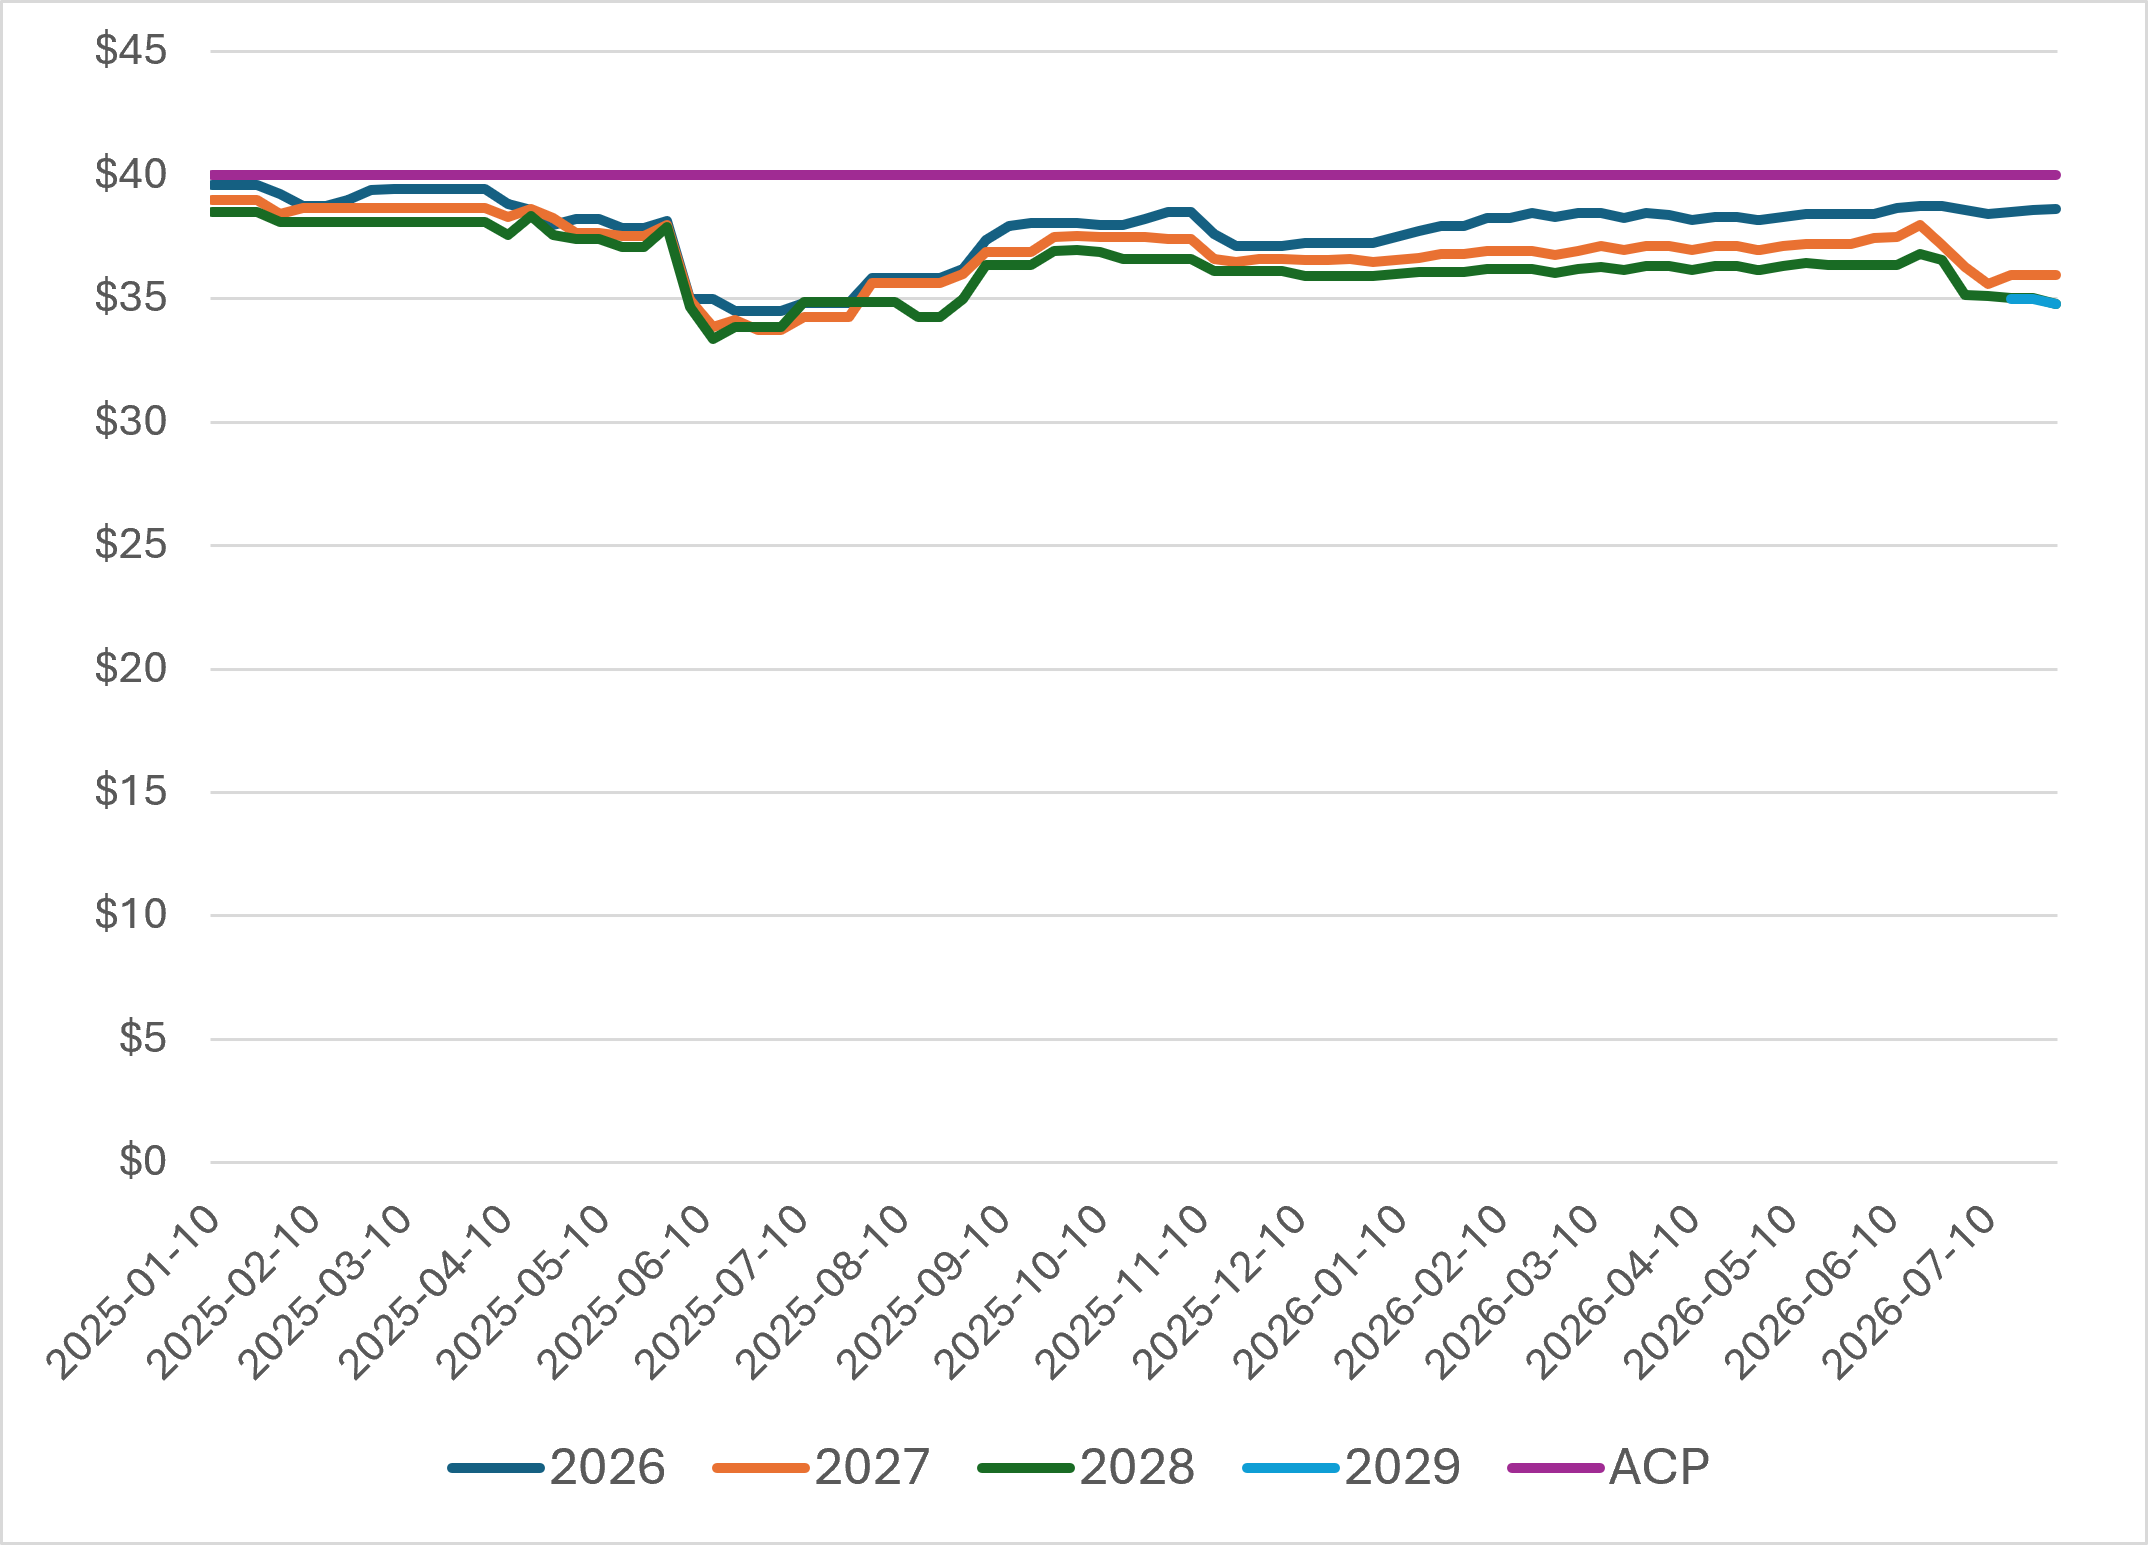
Figure 8 shows historical pricing by vintage. There are two notable dips in this chart. The first occurs around July 1, 2025. That’s when Connecticut passed SB4 “An Act Concerning Energy Affordability, Access and Accountability”, which reduced the Connecticut RPS. The second occurred in July 2026, when the Massachusetts Senate passed S.3143 which proposes to reduce the RPS for 2027-2030. This bill is now in conference committee, and the fate of the RPS reduction is uncertain. These enacted and proposed policy changes are described below along with changes made by Rhode Island.
Figure 8. MA Class 1 REC Historical Pricing by Vintage, Last 2 Years ($/REC)
Recent state-level policy changes
Connecticut
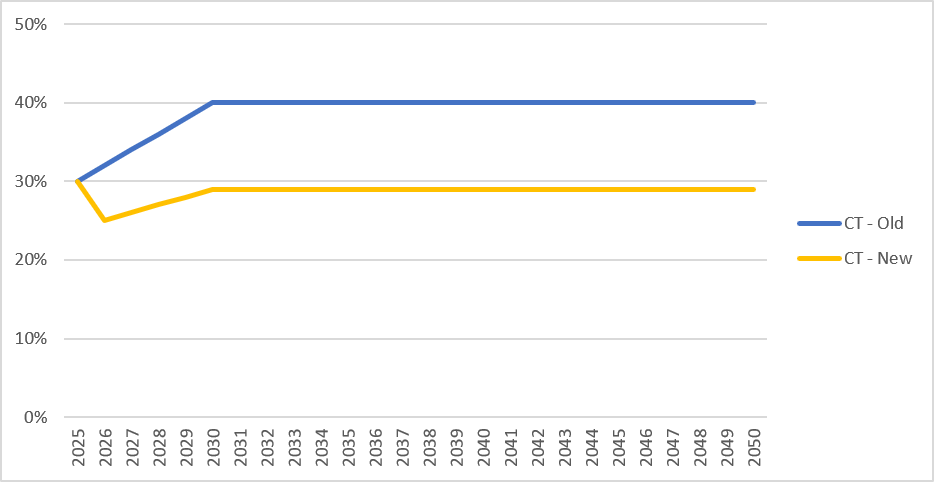
In June 2025, Connecticut passed Senate Bill 4 which lowers the state RPS as shown in Figure 9. The new RPS now dips from 30% in 2025 to 25% in 2026 before increasing to 29% in 2030 where it remains. That is 11 percentage points below the previous RPS of 40% in 2030.
Figure 9. Connecticut Class 1 RPS – New vs. Old
The bill also removed methane gas and new wood-burning biomass from Class 1 REC eligibility, tightening what counts as qualifying renewable generation even as the overall target was lowered. The impact of this change on overall supply-demand will be minor as methane gas and wood burning biomass are not large contributors to supply.
Another proposed bill (SB 1560, “An Act Concerning Connecticut’s Economic, Electricity Affordability and Business Competitiveness and Establishing the Connecticut Energy Procurements Authority and the Green Bond Fund”), would have made existing nuclear an eligible Class 1 resource. The Millstone plant in Connecticut generates about 16 million MWh per year and if it were to become an eligible resource, it would tank the Class 1 market. However, there was fierce pushback on this bill from renewable energy industry stakeholders and it has not moved forward. Yet, the idea that this was even proposed has spooked market participants to some extent.
Rhode Island
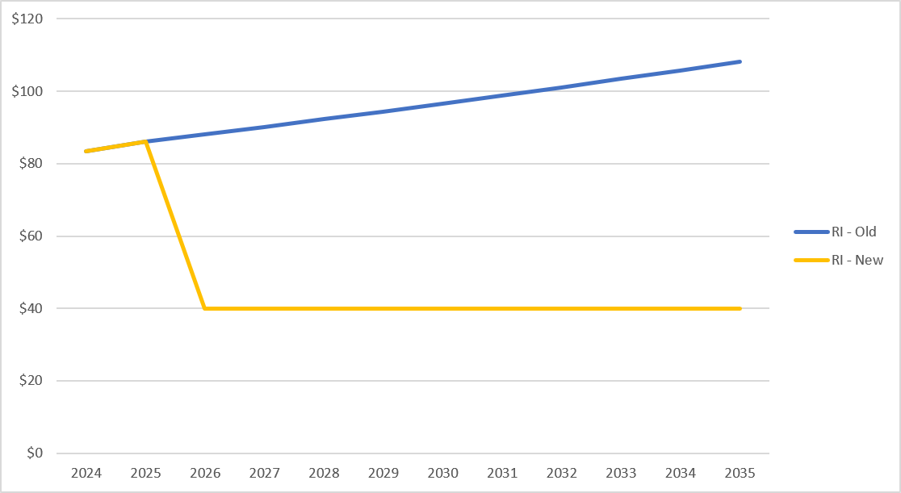
In June 2026, Rhode Island made changes to the state RPS in its FY2027 budget. Rhode Island is allowing more existing renewables to be used for compliance in the “new” category. Until 2026, that had been capped at 2%. But with the FY2027 budget, it ramps up to 20% by 2033 as follows: 2% in 2026, 14% in 2027, followed by 1%/year increases through 2032. The use of existing renewables for compliance is capped at 20% from 2033 onward. This serves to increase supply. The budget also reduced the ACP to $40 flat nominal (Figure 10), which is the same as Massachusetts and Connecticut. Previously, the ACP was at $87 and rising with CPI. This now further cements the ceiling price for the regional market at $40.
Figure 10. Rhode Island's Old and New ACP Rate
Massachusetts
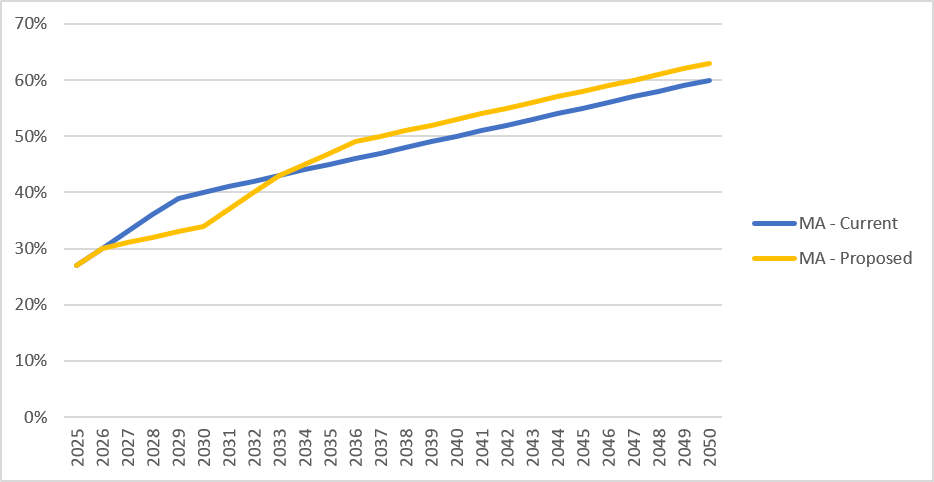
On July 1, 2026, Senate passed S.3143 (“An Act to Save People Money, Repair the Climate and Grow the Economy”). The bill reduces the RPS from 2027 to 2030, giving some relief to ratepayers in the near term, but then increases RPS requirements thereafter (Figure 11).
Figure 11. Massachusetts Class 1 RPS – Current vs. Proposed
The bill also increases the offshore wind requirement to 10 GW by 2040.
Earlier this year, Andrew wrote about Maura Healey’s Executive Order that requires 4 GW of new solar over the next 10 years. If and how this plays out remains to be seen.
Massachusetts Clean Energy Standard (CES) will no longer impact the Class 1 REC market beginning in 2026
To date, the Massachusetts market has added complexity to the supply-demand dynamics of the Class 1 market because of the Clean Energy Standard (CES), which allows zero emission RECs including large hydro and nuclear. With the arrival of the New England Clean Energy Connect (NECEC) project in 2026, things have changed. Compliance entities will be able to use credits from that project for compliance rather than using Class 1 RECs or paying the ACP (Figure 12).
The CES ACP is $35. The lower ACP price has meant that since 2021 compliance entities have preferred to utilize all Class 1 certificates for Class 1 compliance, banking surplus Class 1 certificates for future Class 1 compliance and paying the CES ACP. Prior to NECEC, there were no hydro or nuclear credits available to comply with this requirement.
Figure 12. Compliance with Clean Energy Standard (CES) Requirements (# of RECs), 2019-2026E
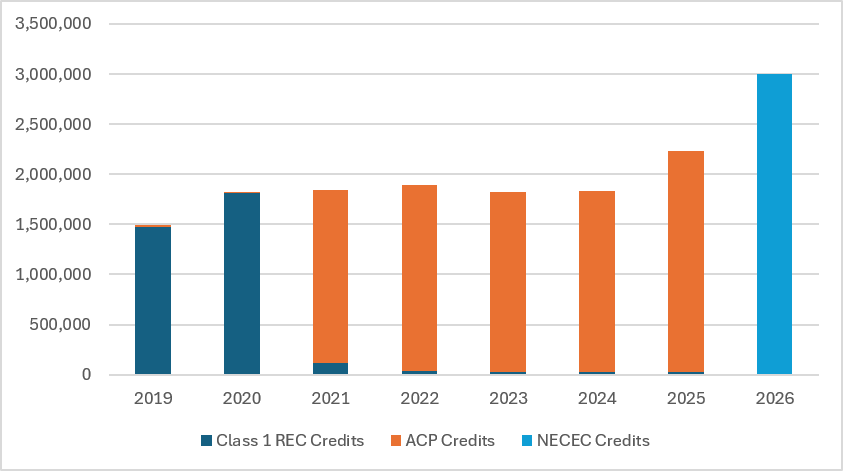
We expect that beginning in Compliance Year 2026, credits from the NECEC project, which first started delivering hydro power from Quebec in January 2026, will be used to cover 100% or close to 100% of the CES requirement as shown by the light blue bar in the figure. At that point, Class 1 RECs will no longer be diverted to be used for compliance with the CES, nor will ACP payments need to be made. As a result, Class 1 REC demand will decline by about 2 million RECs.
Offshore Wind
Beginning in 2025, the federal administration has essentially shut down the offshore wind industry to new project development in New England. Aside from one much smaller earlier project, Block Island (30 MW), two large projects are in the process of reaching full capacity:
• Vineyard Wind (806 MW), off the coast of Massachusetts, which began generating electricity in 2024 but has been plagued with problems during the commissioning phase
• Revolution Wind (704 MW), off the coast of Rhode Island, which began injecting power to the grid in March 2026 and is expected to reach full commercial completion by the end of this year.
As regards Vineyard Wind, construction of all 62 turbines wrapped up in March 2026, but the project has been stuck in a troubled commissioning phase since. As of May 2026, only 49 of the 62 turbines were activated, with average output around 300 MW – well under half of the project's nameplate capacity. Recurring sensor issues are causing turbines to trip and shut off, curtailing performance further.
Underlying this delay is a legal and technical predicament stemming from a catastrophic blade failure in July 2024, when a 351-foot GE Haliade-X blade fractured and scattered fiberglass debris on Nantucket beaches. An investigation found 68 of 72 installed blades were defective, forcing a lengthy replacement program. Vineyard Wind and blade/turbine supplier GE Renewables are now suing each other – Vineyard Wind seeking roughly $500 million over the defects and lost PPA profits, GE countering that it's owed about $300 million in withheld payments – and GE's attempt to exit the supply contract has so far been blocked in court.
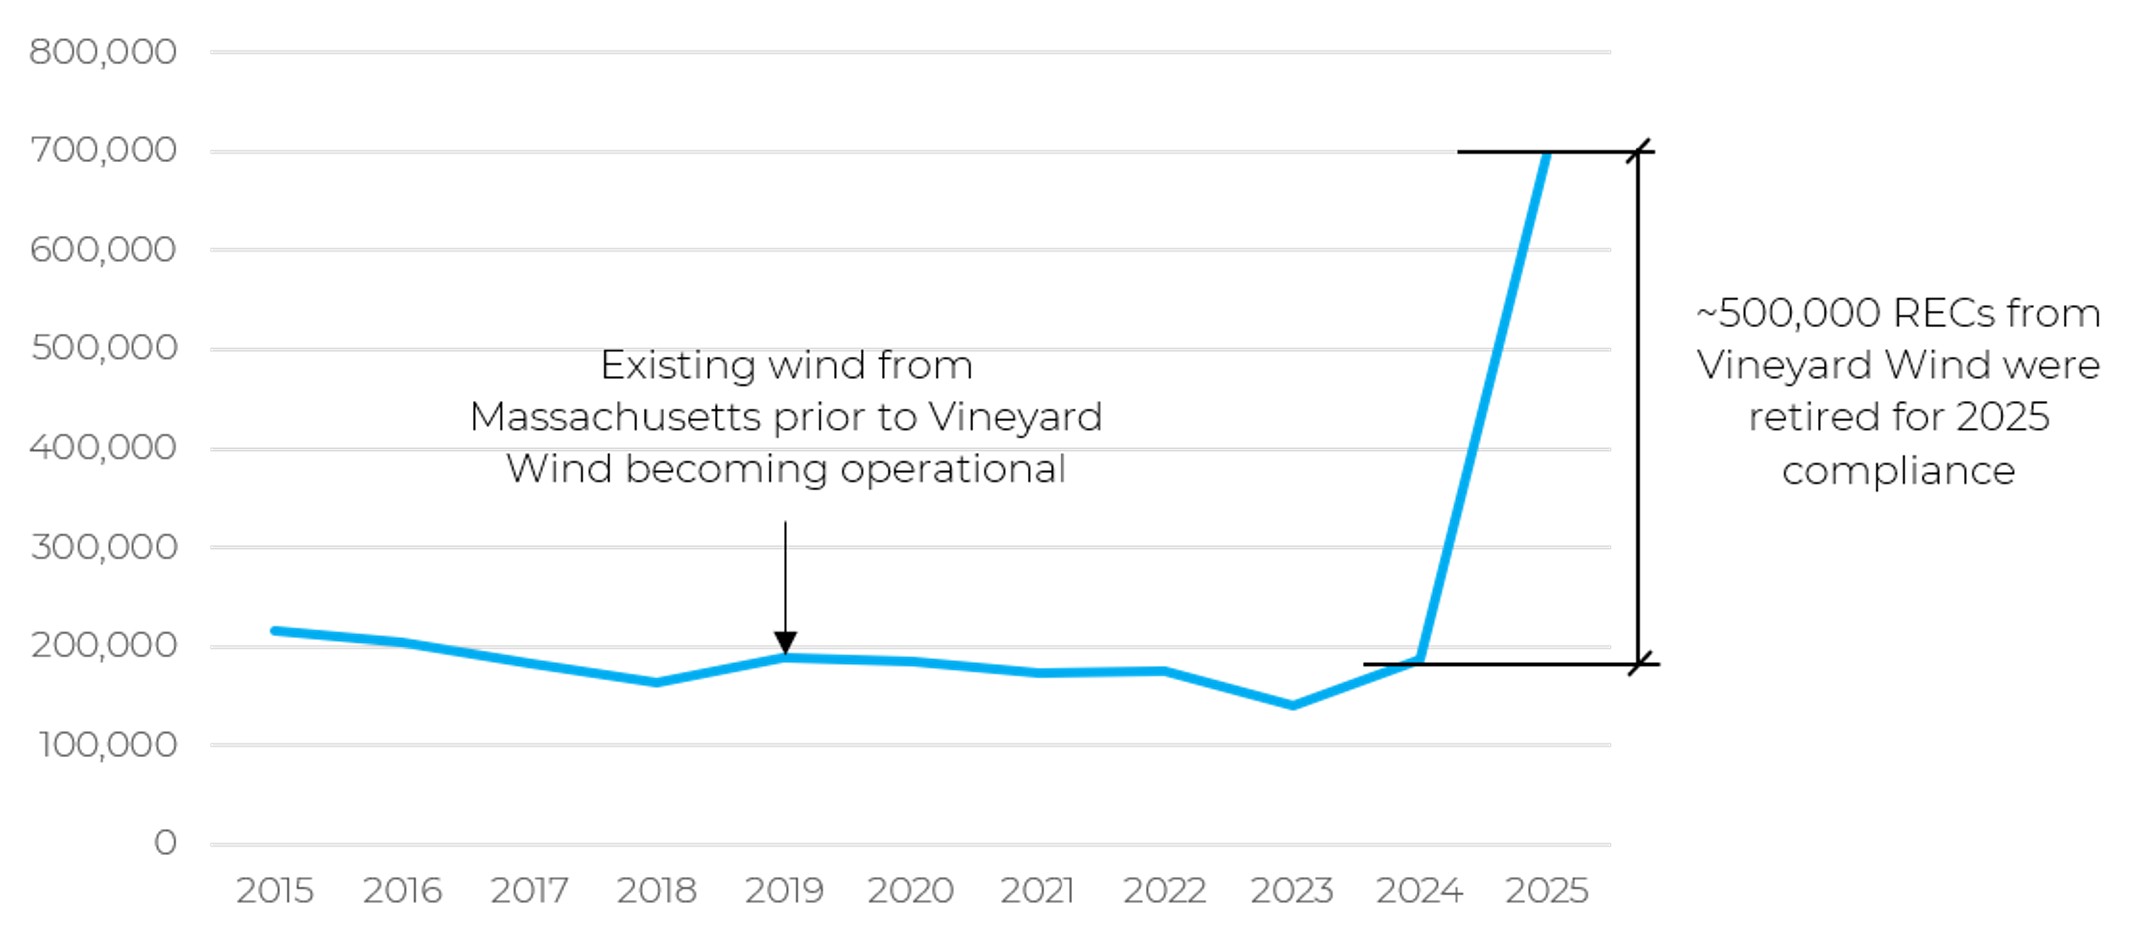
According to data from NEPOOL GIS, about 500,000 RECs were retired from the Vineyard Wind project in 2025 (Figure 13), far below the expected 3.4 million it should be able to generate at full capacity.
Figure 13. Massachusetts-generated Wind RECs retired in Massachusetts, 2015-2025 (# of RECs)
The timing of if and when the offshore wind industry comes back is an open question. There are many obstacles to overcome for the industry including the following:
• It’s currently the highest cost renewable resource
• It takes 1-2 and maybe even 3 presidential terms to bring a project online from beginning to end. Are developers willing to take the risk?
• How will the commissioning problems with Vineyard Wind be viewed by potential developers/investors?
• To restart the industry after it’s been dormant for some number of years will not be insignificant
Ultimately, given the decarbonization goals of the region, we do expect that eventually the industry will come back.
Long Term Supply-Demand and Market Outlook
Power Advisory prepares a wholesale energy price forecast and Class 1 REC price forecast for ISO-NE using an integrated modeling process. PLEXOS is used to model wholesale prices and the associated capacity expansion. The resulting generation buildout determines Class 1 REC supply, while REC prices feed back into the capacity expansion.
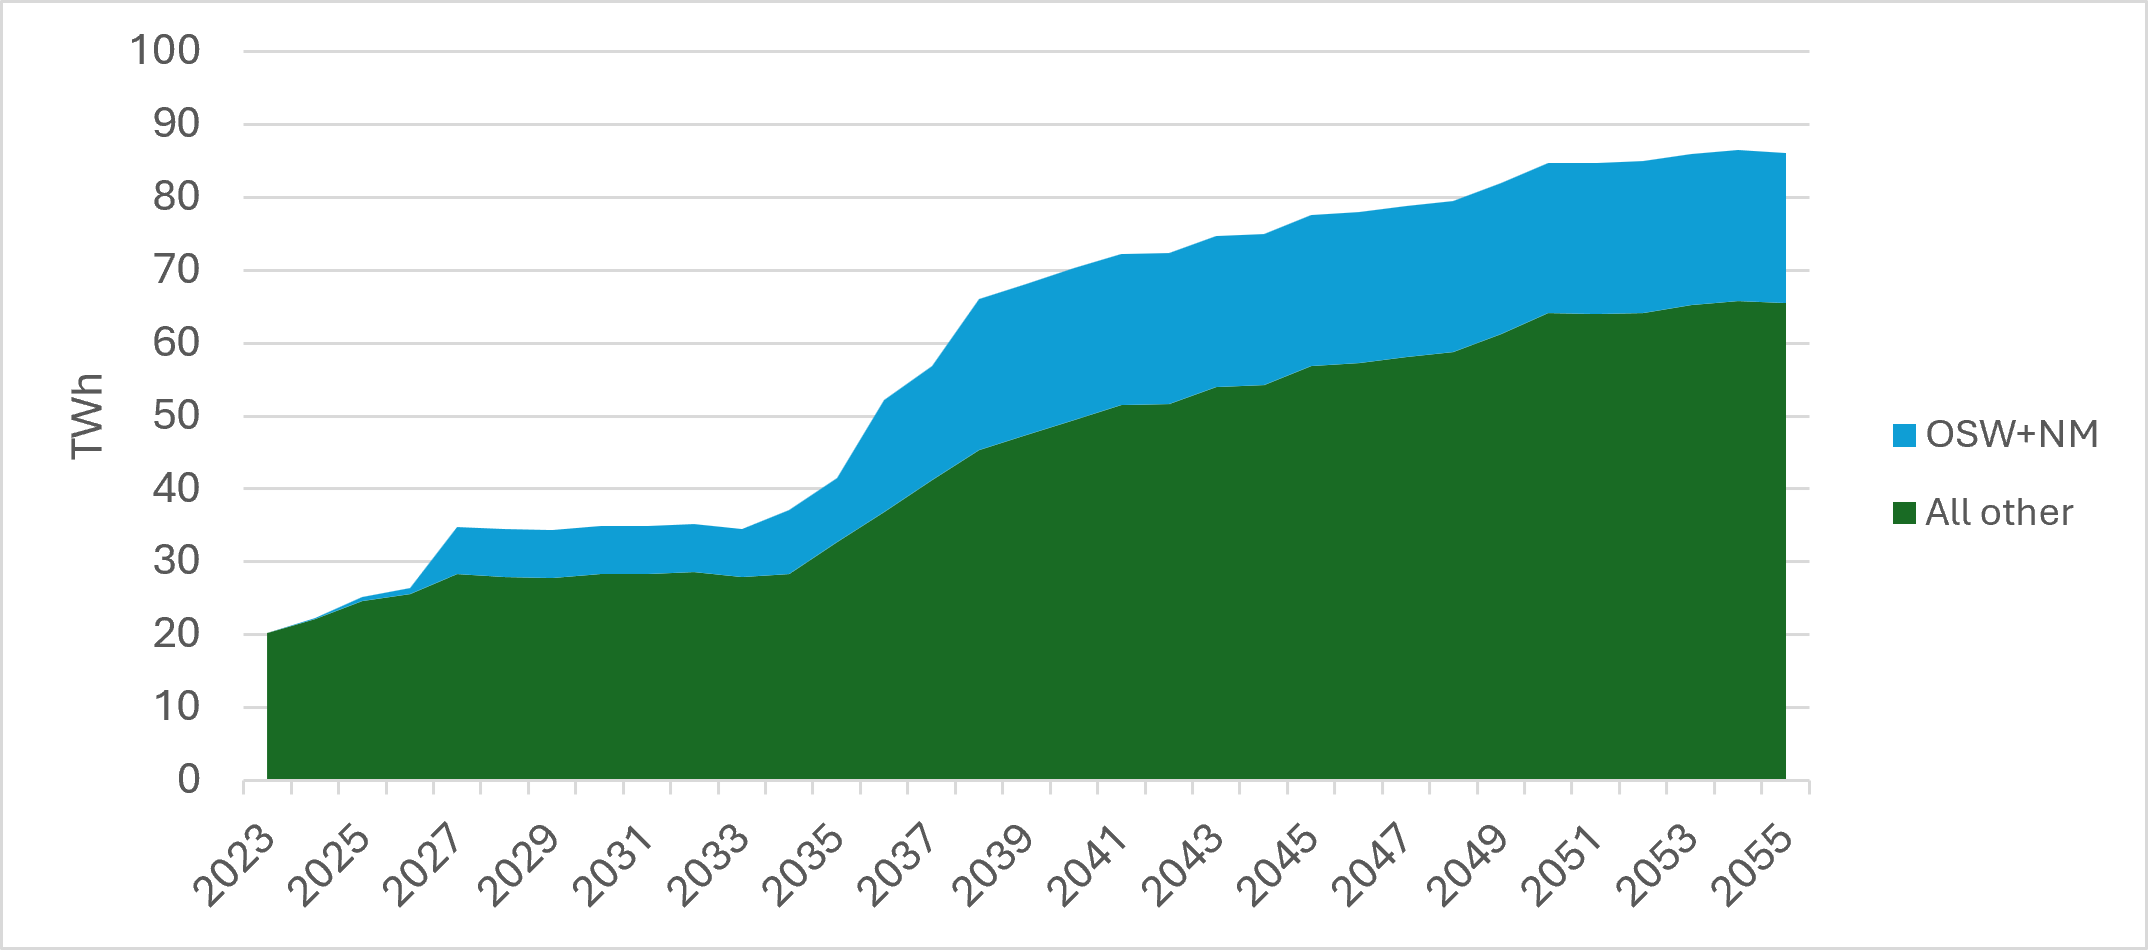
Figure 14 shows the REC supply from 2023 to 2055 in terawatt-hours while Figure 15 shows the demand. Figure 14 includes two categories: (1) offshore wind + the Northern Maine onshore wind project and (2) All other technologies (i.e., solar, wind, low impact hydro, biomass, landfill gas, fuel cells, etc.). The offshore wind category includes the 1,200 MW Northern Maine onshore wind project.
Figure 14. REC Supply 2023-2055 (TWh)
Note: OSW+NM = Offshore Wind + Northern Maine Onshore Wind
Figure 15. Demand (TWh)
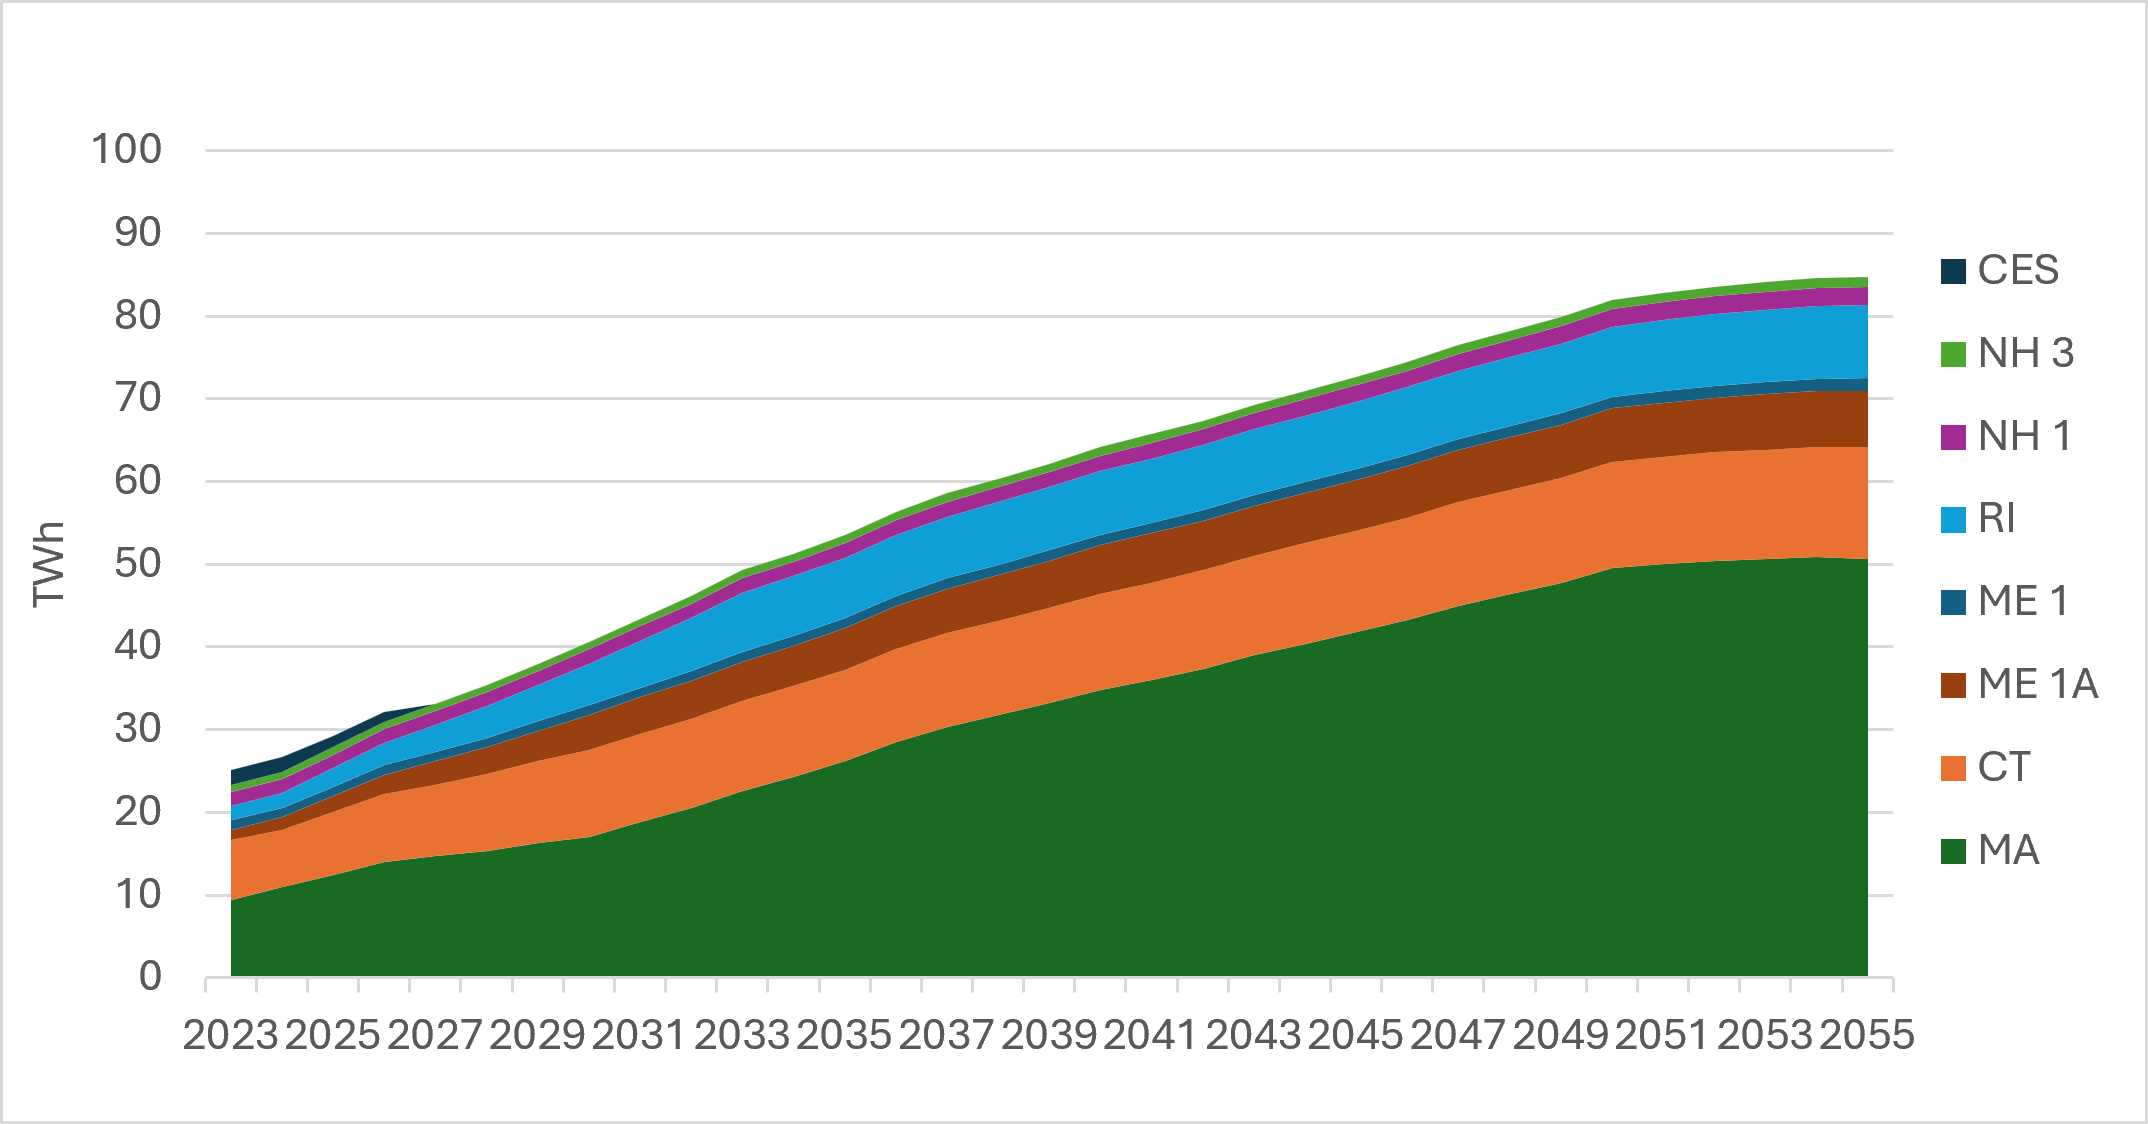
Note: the chart assumes that the proposed Massachusetts change in RPS goes through as per the Senate bill (S.3143) that passed
The model indicates that in terms of supply, there is limited growth for the next 10 years. This limited growth is mainly a function of safe harbored solar projects, and to a lesser extent, wind projects. As one example, the 100 MW Three Rivers Solar project is expected to reach commercial operation later this year or in early 2027. While it’s difficult to estimate, there could be upwards of 500 MW of safe harbored projects. Beyond that, renewables face a more difficult road because of the phaseout of the ITC and PTC. The supply forecast then increases in the mid to late 2030s with more solar, offshore wind and onshore wind coming online, indicating a reboot of the industry.
Based on this base case supply and demand forecast, the market should remain undersupplied through the mid to late 2030s. At that point, our modeling shows slight oversupply which we expect will be tolerated. In other words, the market may not know the market is oversupplied or sellers could keep the market tight enough to preserve pricing that is closer to the ACP.
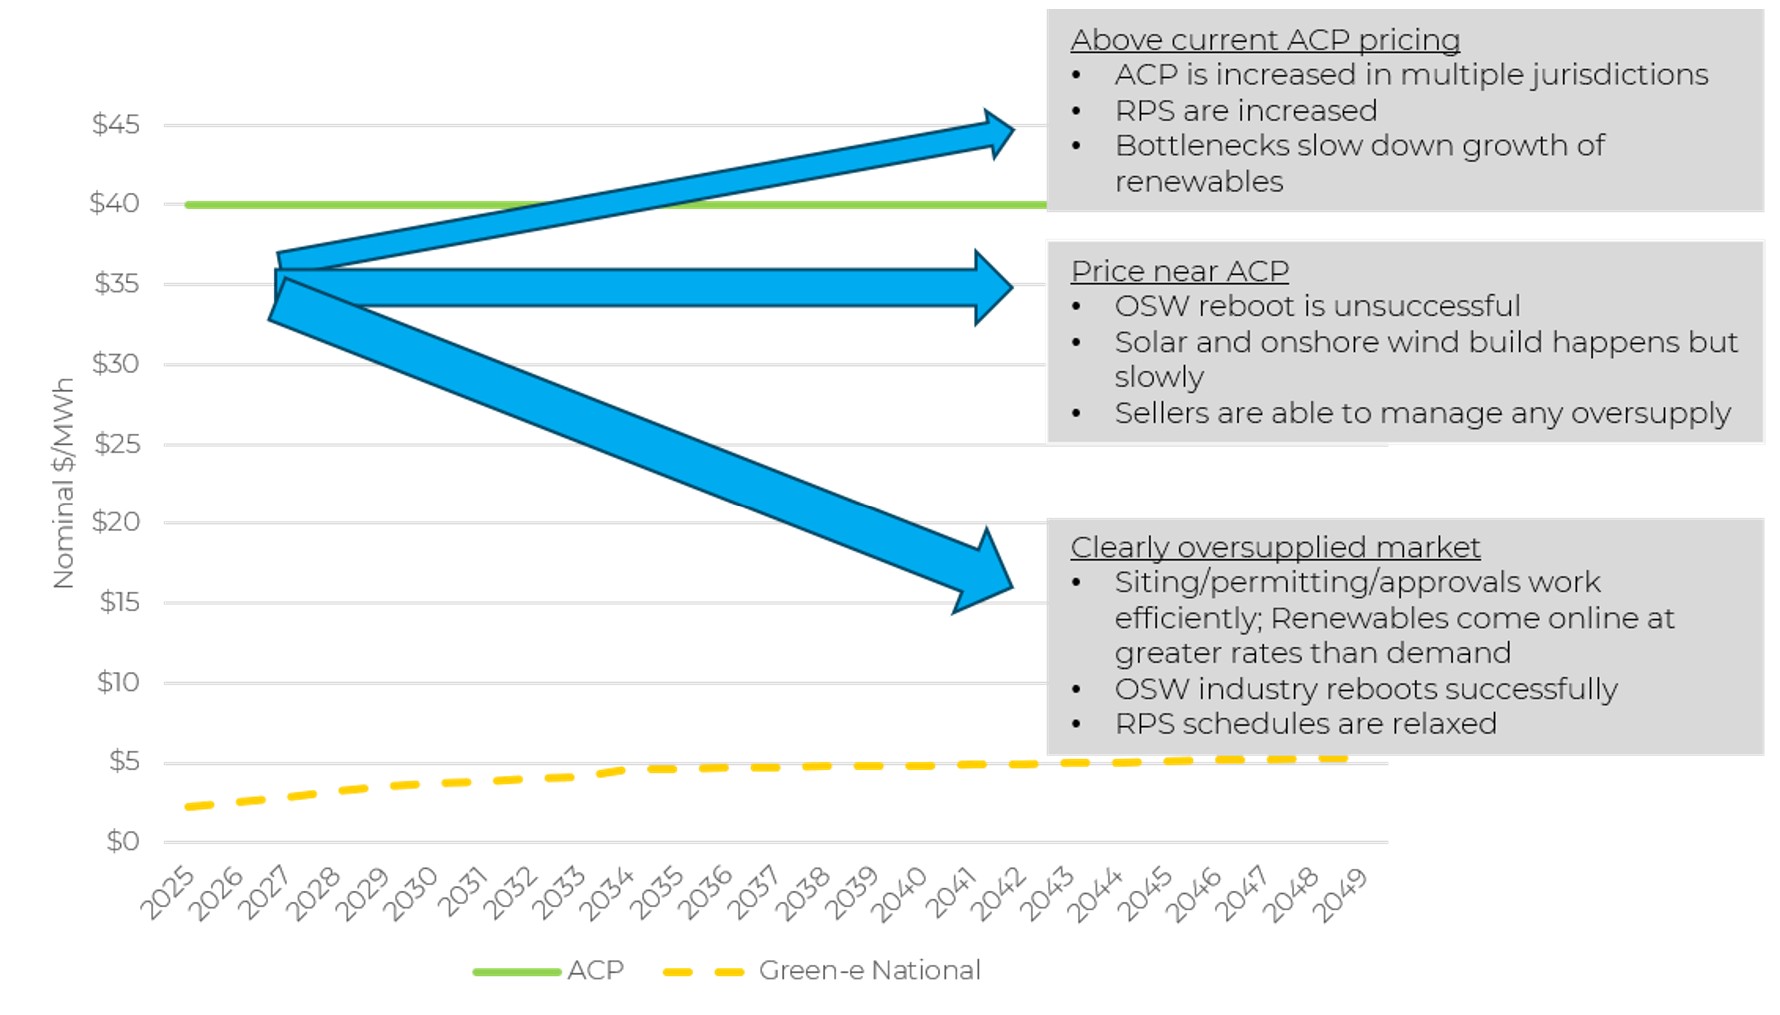
The reality is, however, there is a great deal of uncertainty with respect to many variables. All these factors can drive price in different directions. Figure 16 shows how price may be driven slightly higher, sideways, or down. At this point, the higher price option is unlikely given that three jurisdictions would have to adjust their ACP upward. Thus, the debate mostly comes down to the remaining top options.
Figure 16. High Level Pricing scenarios
In 2024, when offshore wind and renewables were supported by the federal administration, Power Advisory was of the opinion that prices would remain near the ACP for a few years before declining as large amounts of offshore wind were expected to come online, tipping the market into oversupply.
Over the past 18 months, as the reasonable timeline for a reboot of offshore wind in New England has been extended further, and with the scheduled phase out of the ITC and PTC, our position has changed. We now believe that the undersupply situation (or near equilibrium) will persist for a much longer period. With policymakers increasingly prioritizing affordability, two states have made changes to their RPS and ACP, while a third is considering making changes. Even after these realignments, our supply-demand model suggests that the market will be undersupplied or just slightly oversupplied for years to come. Until there is concrete evidence of a clearly oversupplied market, Power Advisory believes that prices will remain above $30 for an extended period.
Andrew Kinross is a Director with Power Advisory and can be reached at akinross@poweradvisoryllc.com.
Greg Peniuk, Senior Manager, can be reached at gpeniuk@poweradvisoryllc.com.